
Ecological monitoring
Vuntut National Park
The Vuntut National Park monitoring program is a joint effort by Parks Canada, the Vuntut Gwitchin Government, the North Yukon Renewable Resources Council, and researchers from several universities. The program combines scientific results and traditional knowledge to assess how and why the park’s environment is changing. Together we track changes in Porcupine Caribou Herd habitat and the hydrology and ecology of lakes in the Old Crow Flats, and produce data that contribute to national and global efforts to understand how climate change is affecting the north.
Northern context
From 1948 to 2016 the average surface temperature in northern Canada has increased by 2.3° C, roughly three times the global average. With this warming comes dramatic changes to the northern landscape: wildlife habitats are shifting, the winter snow cover period is shorter, permafrost is warming, and lake water levels are becoming more dynamic. While images from satellites measure change at the landscape scale and climate models are used to predict future conditions there is a need for long-term monitoring in northern Canada that accurately measures what is happening on the ground.
Methodology
Monitoring approach
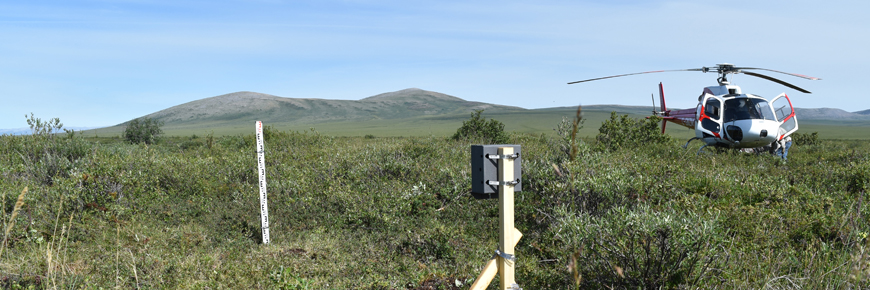
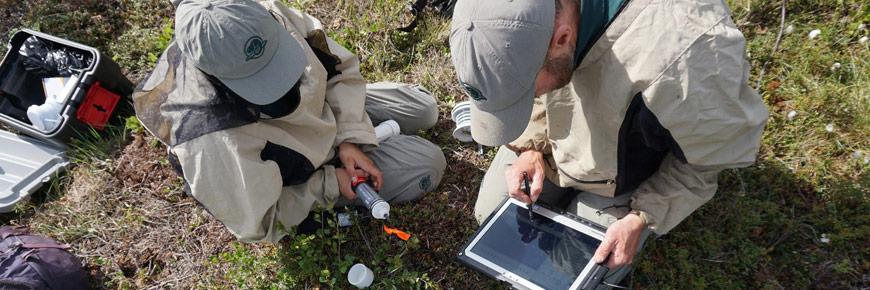
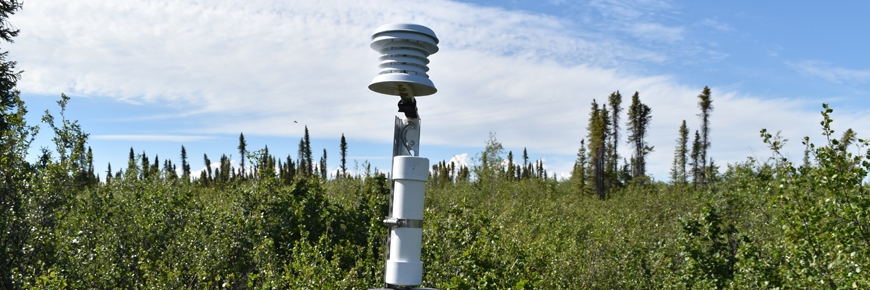
Monitoring methods need to be extremely efficient as a helicopter is the only practical means of accessing the park. The approach is to make yearly visits to monitoring sites spread throughout the park which measure several ecosystem components – permafrost, snow, vegetation growth, and air temperature – at each site. Some measurements are made “on the ground” during site visits, while others rely on data and images recorded by data loggers and trail cameras that run throughout the year.
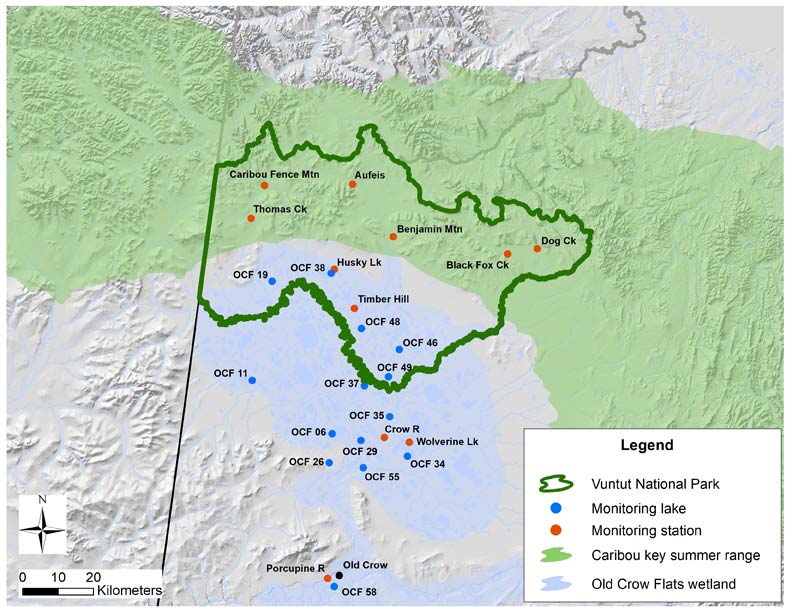
Monitoring sites
Vuntut monitoring program map
Ecosystem components
Porcupine Caribou Herd
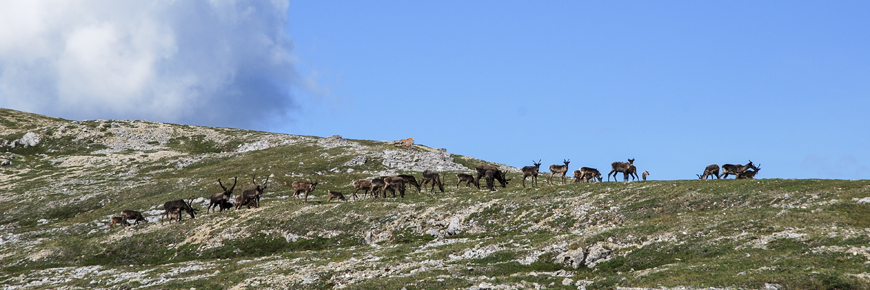
The Porcupine Caribou Herd is a population of barren-ground caribou (Rangifer tarandus) whose range includes the northern Yukon, Alaska and the Northwest Territories. It is one of the largest caribou herds in North America. The herd is critically important to the Vuntut Gwitchin, and protecting portions of its spring, summer and fall habitat was one of the main reasons for creating Vuntut National Park.
Monitoring measures
Population size
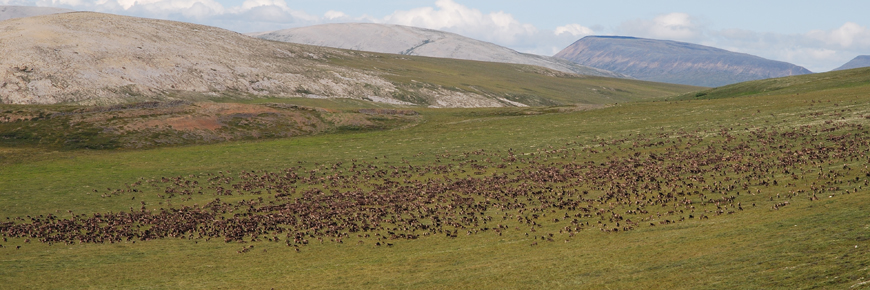
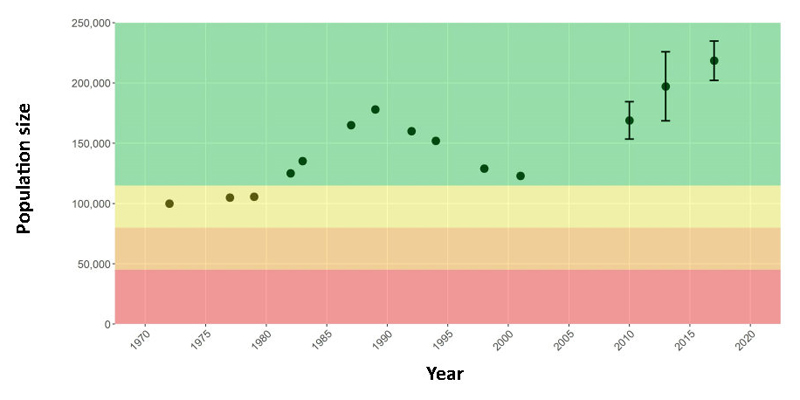
Population counts have been conducted since the 1970s and are typically attempted every two to three years. To conduct a count the caribou are located in early summer by tracking the movements of approximately 100 individuals with GPS collars. During this time the caribou often gather in large groups to avoid insects. If the herd groups-up researchers are able to fly over it and take pictures with a high resolution digital camera. From the pictures researchers can count the number of animals. Counts since 2000 have used the location of collared caribou to create a population estimate with a confidence interval rather than just a minimum count. This approach provides a sense of how accurate the count is.
The most recent count was conducted in 2017 and estimated that the herd was approximately 220,000 caribou. This is the highest number that has ever been recorded for the Porcupine Caribou Herd.
Porcupine Caribou Herd
Snow cover
The annual duration of snow cover in the circumpolar Arctic has decreased by two to four days per decade over the past 30 to 40 years.
Snow cover is important as it is known to influence the timing of Porcupine Caribou Herd migration to their calving grounds in the spring and affects many other aspect of northern ecosystems including permafrost temperatures, lake and river ice, vegetation and lake hydrology.
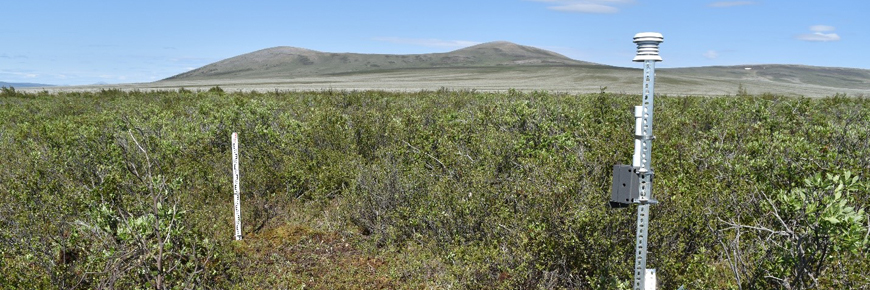
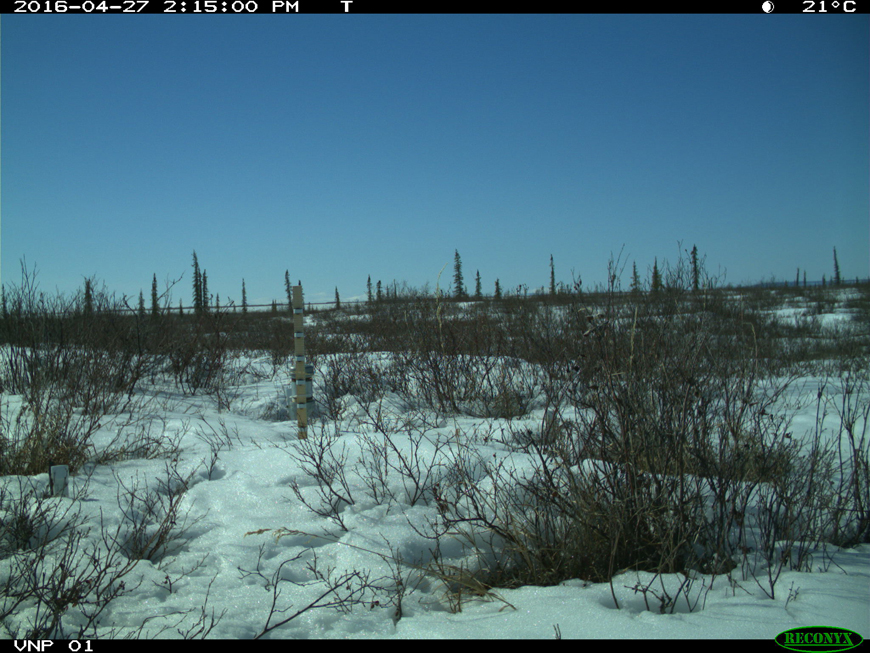
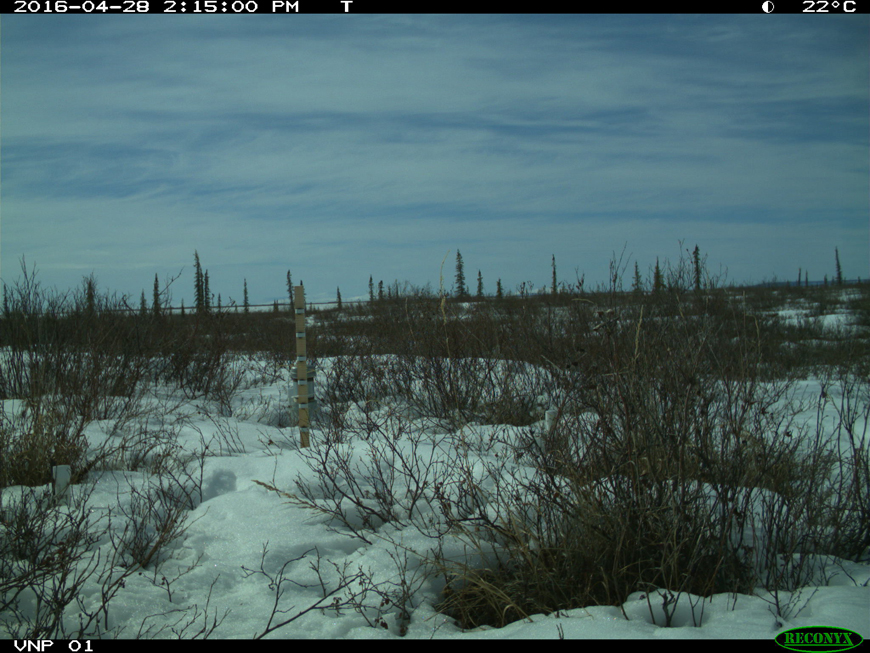
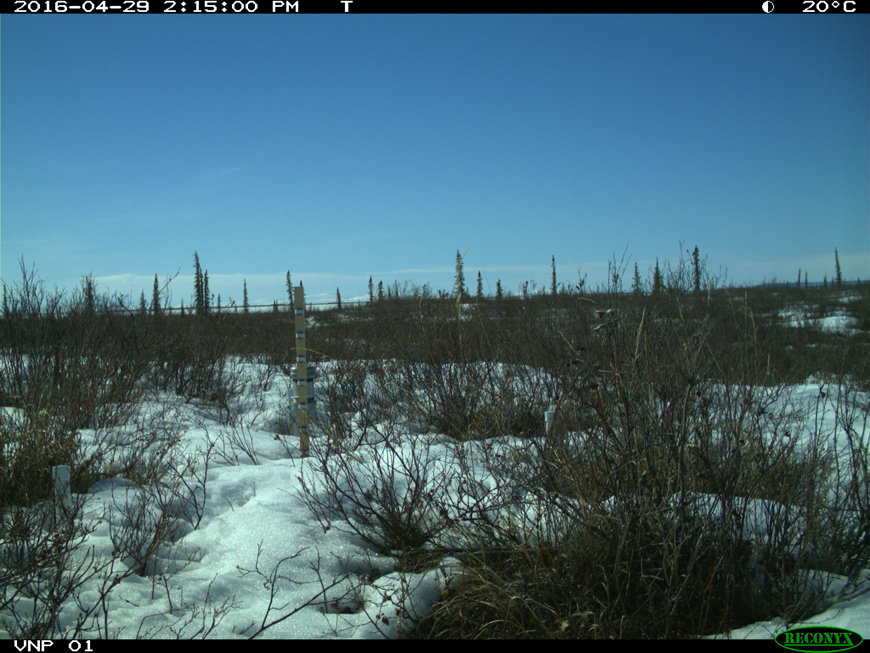
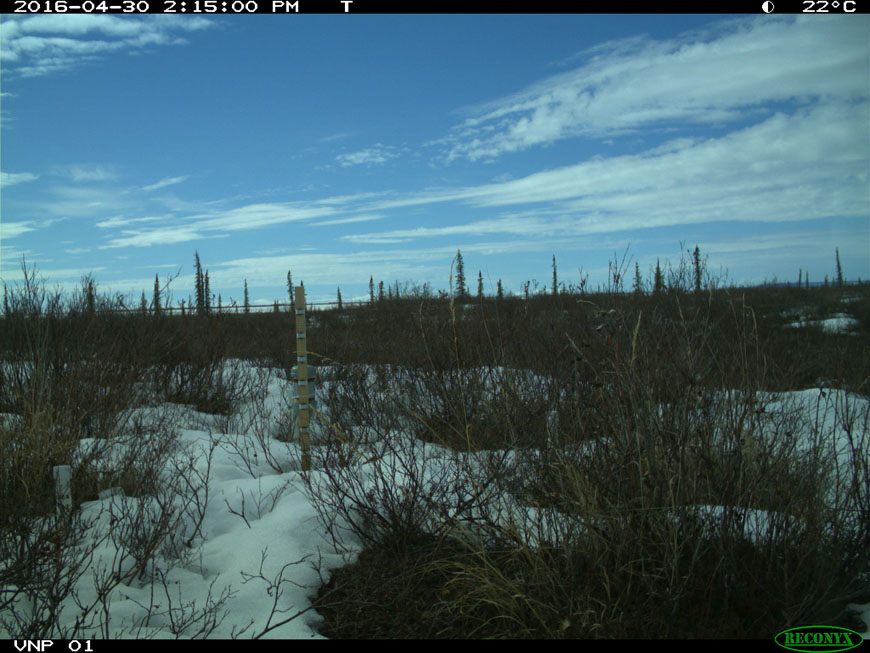
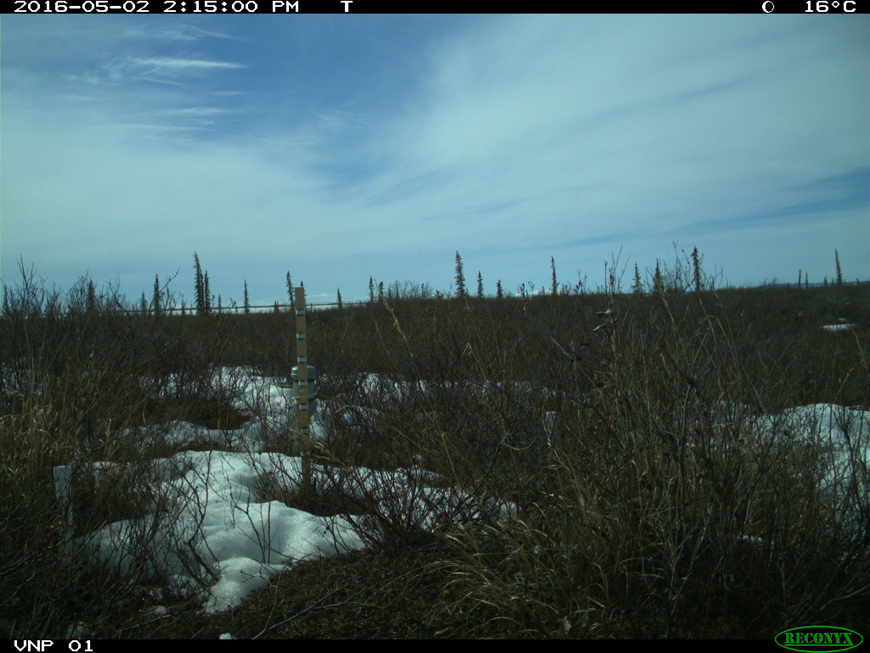
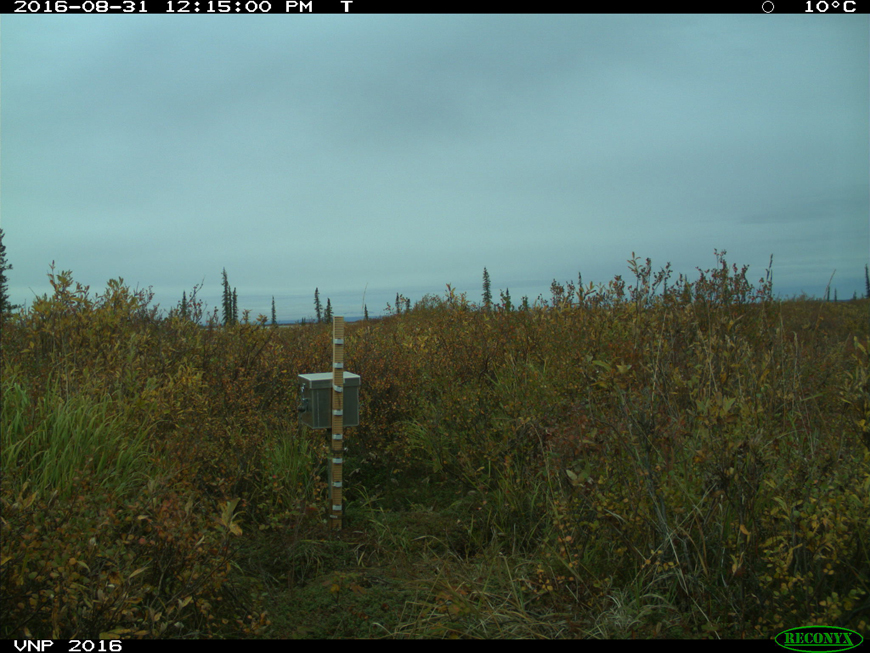
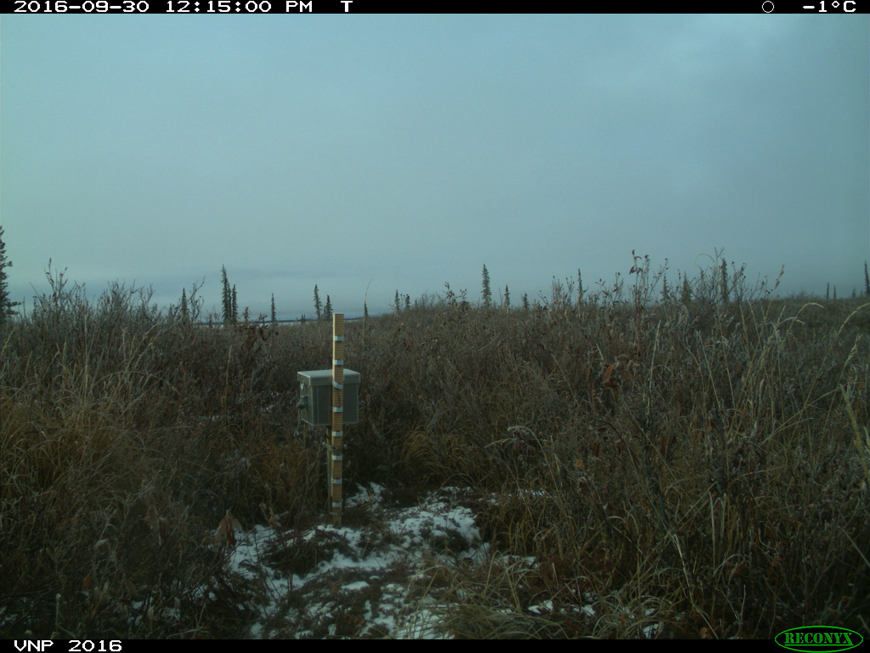
Snow cover is measured at monitoring sites using a trail camera facing a snow stake. Snow depth is determined from pictures of the stake taken once each day throughout the winter. These depths are then used to determine the duration of snow cover and the average snow depth for a winter.
Husky Lake monitoring site: Spring melt
2016-04-27
2016-04-28
2016-04-29
2016-04-30
2016-05-01

2016-05-02
Growing degree days
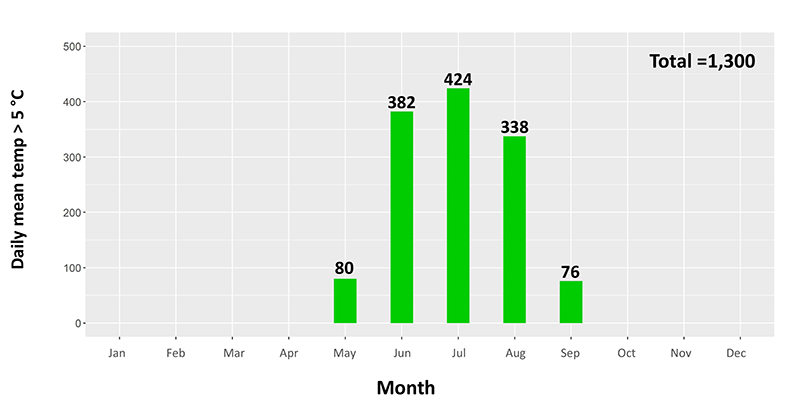
Growing degree days describes the period of the year during which warm air temperatures permit plant growth. As air temperatures rise in northern Canada the period of time during which plant growth can occur should also increase.
This could change the amount of forage available to caribou and the timing of when it's of highest nutritional value. Air temperature is also crucial for interpreting changes in permafrost temperatures, snow cover and vegetation growth.
Air temperature is measured every hour at monitoring sites throughout the park. Measurements are stored on data loggers that are recovered during site visits and are then used to calculate the number of growing degree days for the year.
Husky Lake monitoring site: 2016 growing degree days
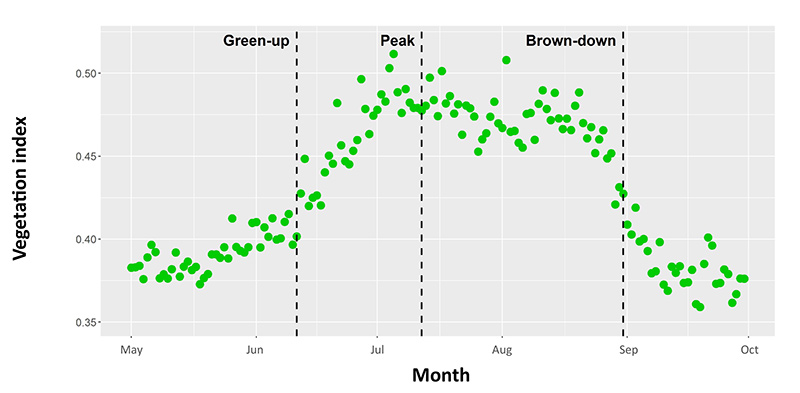
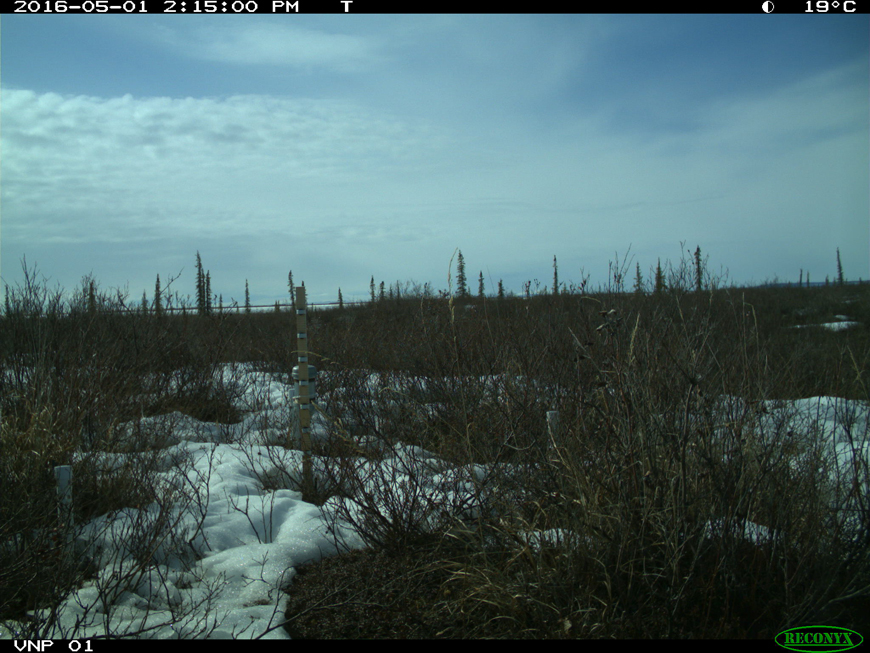
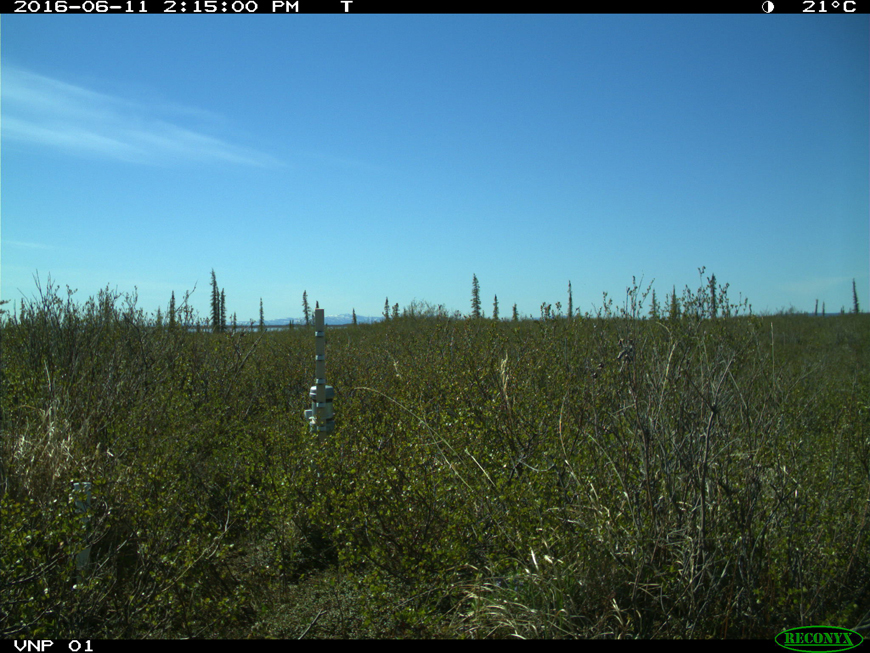
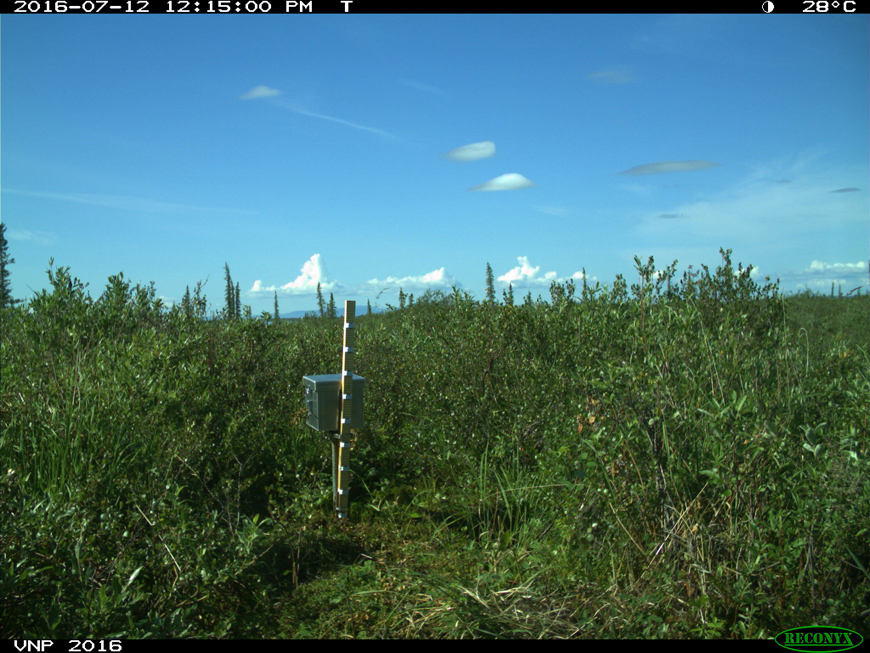
Growing season
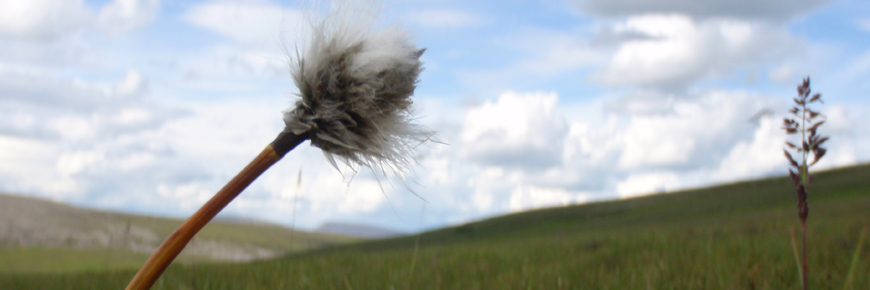
The warming climate is affecting northern vegetation, including the date that plants leaf out in the spring ("green-up"), reach peak growth and then turn colour and drop in the fall ("brown-down"). These changes can affect the amount and quality of caribou forage in important ranges used by the Porcupine Caribou Herd.
When summer caribou range is of a high quality, female caribou are able to build up larger reserves of energy and are then less likely to “wean-off” their calves early and are more likely to become pregnant in the fall. This means that more calves survive their first year of life and that more adult females have calves in the spring. The extra energy reserves also make it more likely that adult female caribou will survive the winter and give the herd an opportunity to grow in number.
Husky Lake monitoring site
2016 growing season
May 1
Green up
Peak growth
Brown down
September 30
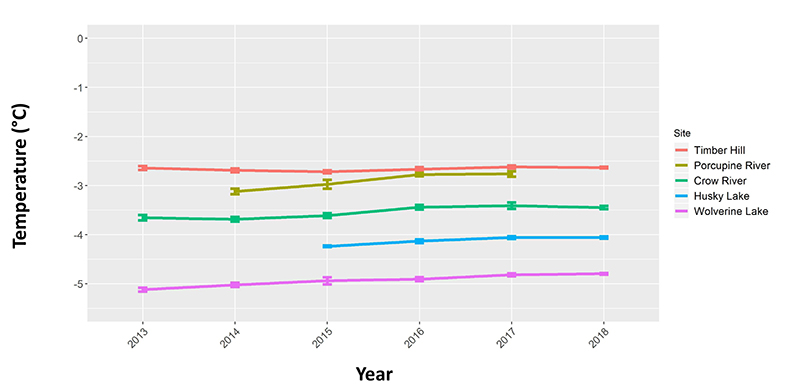
Permafrost temperature
Permafrost – ground that has been frozen for at least two years – is predicted to thaw over large areas of northern Canada as the climate warms. Vuntut National Park lies in the region of continuous permafrost, where it has a widespread influence on ground stability, soil moisture, vegetation and lake hydrology and ecology. Tracking permafrost temperature is also important as there is growing recognition that the widespread melting of permafrost will lead to a release of additional greenhouse gasses into the atmosphere, resulting in even more climate warming.
The Vuntut National Park monitoring sites are part of a network of permafrost probes that are tracking regional shifts in permafrost temperatures across the north.
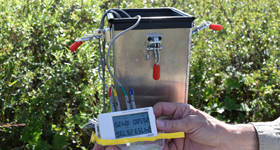
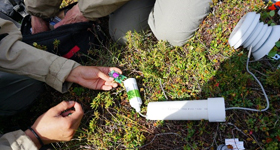
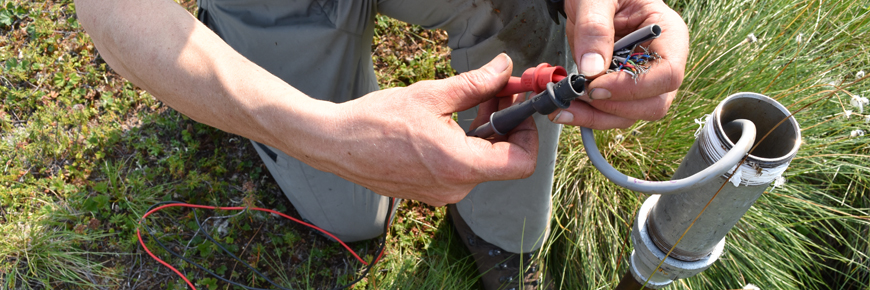
Probes at monitoring sites record permafrost temperature at multiple depths below the ground surface. The deepest probes are equipped with cables that reach 30 m into the ground. Some have to be read manually each year when the site is visited, others have a data logger that records temperatures every hour.
Temperatures at depths of 14 m or more are of particular interest as at these depths values don’t fluctuate much throughout the year.
Permafrost temperatures at 14 m below ground surface at Old Crow Flats monitoring sites
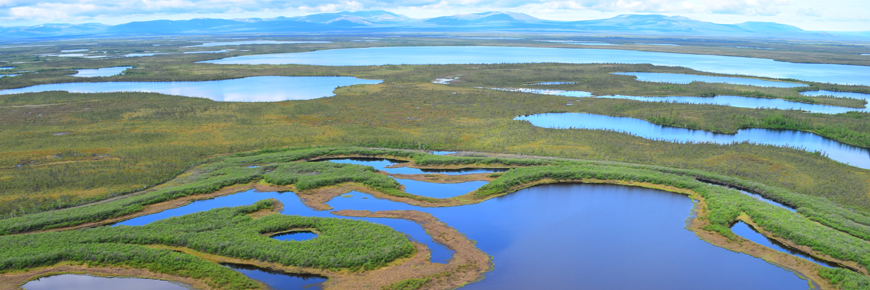
Wetlands
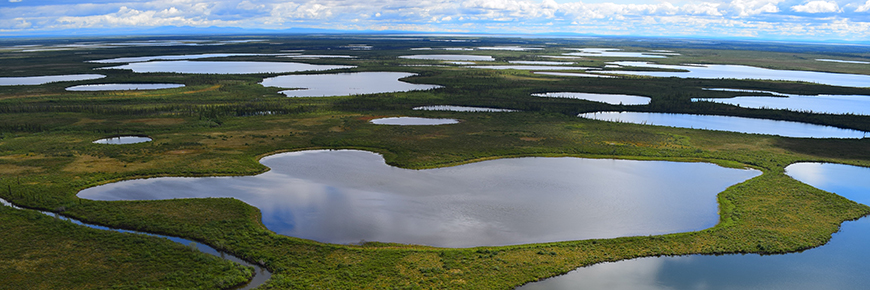
The Old Crow Flats is a vast wetland complex of shallow lakes and small streams. Recognized by the Ramsar Convention as a Wetland of International Importance, it is the breeding ground to half a million migratory birds and home to many species of wildlife. The Old Crow Flats has been referred to by the Vuntut Gwitchin as their “bank account” because of its importance for subsistence hunting and other traditional practices. Portions of the Old Crow Flats are protected by Vuntut National Park.
Monitoring measures
Lake hydrology
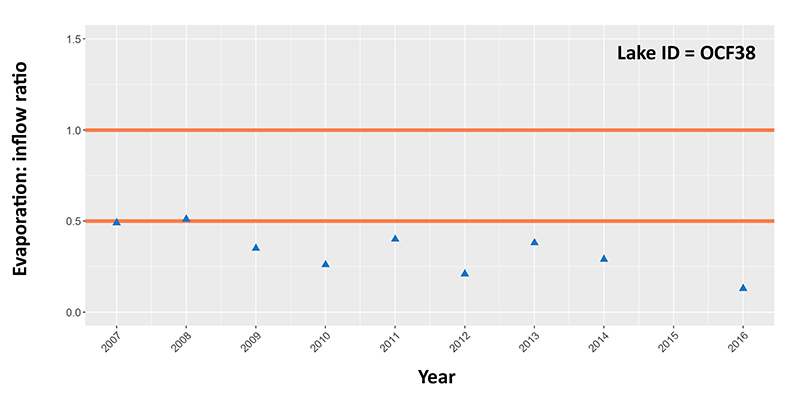
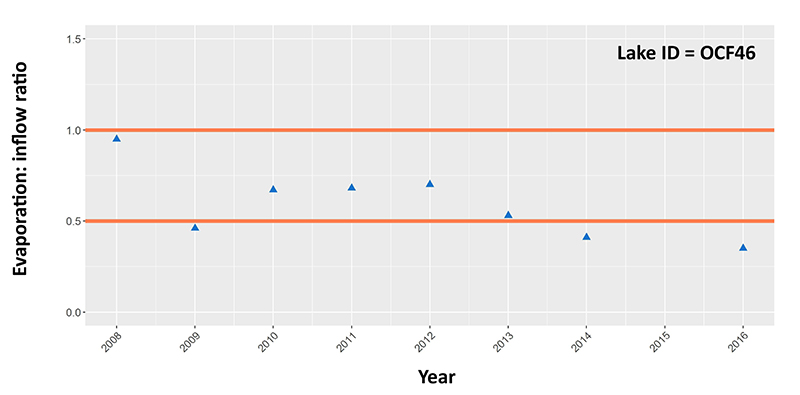
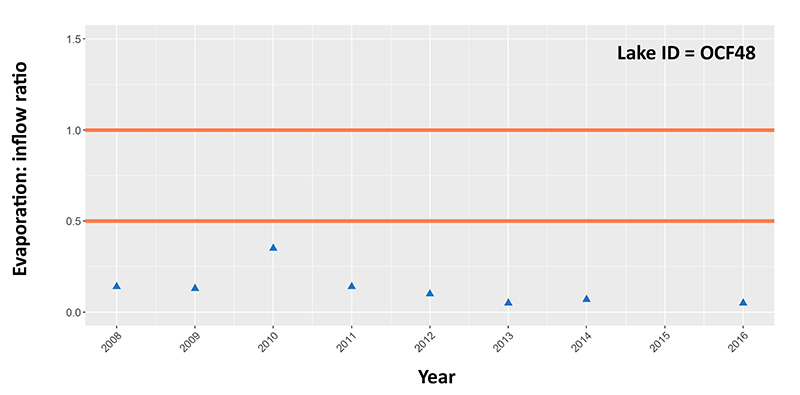
Concerns have been raised that lakes in the Old Crow Flats, including those in Vuntut National Park, are drying out. As a result Parks Canada, First Nation partners and several universities are tracking changes in lake water levels and the amount of water entering lakes in the form of rain and snow.
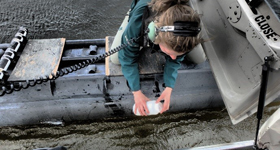
Fourteen monitoring lakes spread throughout the Old Crow Flats, five of which are located within Vuntut National Park, are visited by helicopter each year in the spring and fall. During each visit, lake depth and surface water characteristics such as temperature, pH, dissolved oxygen, conductivity, and temperature are measured and water samples are collected.
Water samples are sent to a lab where isotope tracers are used to tell how much water is entering each lake in the form of rain and snow and if the lake is evaporating over time.
Evaporation vs. inflow in Vuntut National Park monitoring lakes
OCF 19

OCF 38
OCF 46
OCF 48
OCF 49

Lake algae community structure
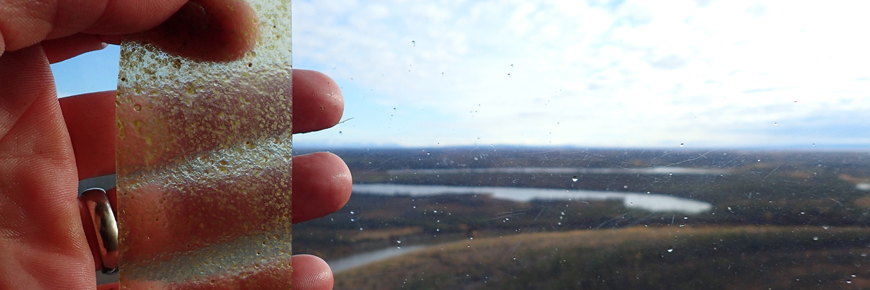
Periphyton – algae that attaches to objects – is used with water isotopes to track changes in the ecology of lakes in the Old Crow Flats.
Periphyton form the foundation of lake ecosystem food chains and are a useful indicator of freshwater ecology as their characteristics are affected by physical, chemical and biological disturbances. They are widely used to monitor water quality in Europe and by the US Environmental Protection Agency.
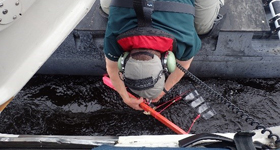
To collect the algae, samplers with plastic strips are anchored in each of the 14 monitoring lakes each spring. Algae grow on the strips throughout the summer and the samplers are recovered in the fall. The samples are sent to a lab and counts of periphyton, their community structure and levels of chlorophyll are used to determine if the ecology of a lake is changing.
Current monitoring is aimed at determining the natural conditions for algae in Old Crow Flats lakes. This baseline condition will be used to determine when lakes are showing signs of stress or are undergoing significant ecological changes.
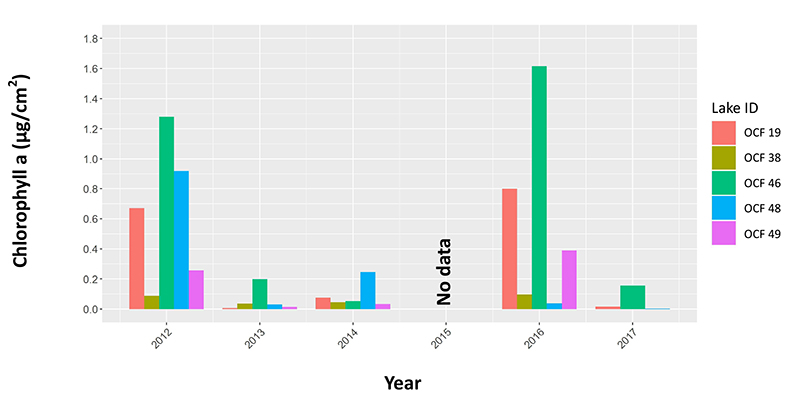
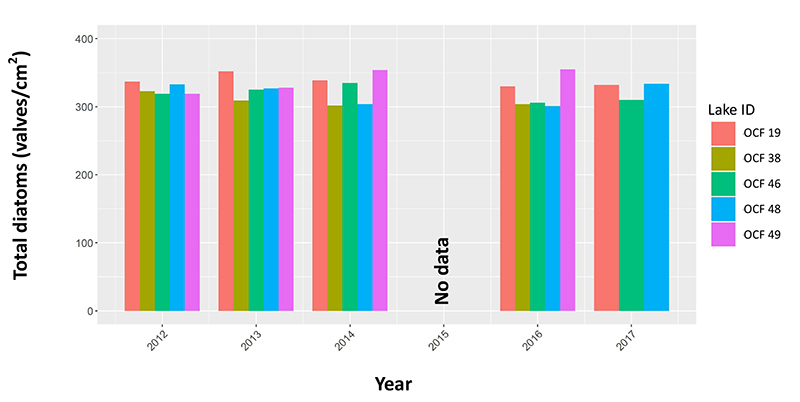
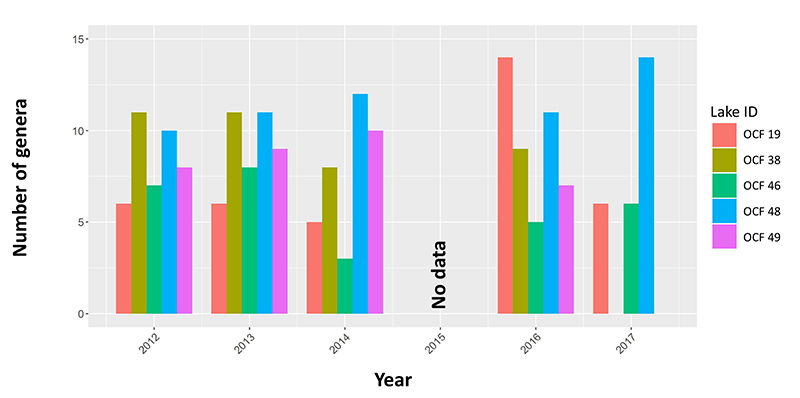
Algae productivity in Vuntut National Park monitoring lakes
Chlorophyll a
Total diatoms
Soft algae richness
- Date modified :