
Quarterly financial report for the quarter ended December 31, 2016
1. Introduction
This quarterly report has been prepared by management as required by section 65.1 of the Financial Administration Act and in the form and manner prescribed by the Treasury Board. This report should be read in conjunction with the Main Estimates, the Supplementary Estimates and the previous Quarterly Financial Reports.
A summary description of the Parks Canada Agency’s programs can be found in Part II of the Main Estimates, and a detailed description in Part III – Report on Plans and Priorities.
This quarterly report has not been subject to an external audit. However, it has been reviewed by the Agency’s Audit Committee.
1.1 Basis of Presentation
This quarterly report has been prepared using an expenditure basis of accounting (modified cash accounting). The accompanying Statement of Authorities includes the Parks Canada Agency’s spending authorities granted by Parliament and those used by the Agency consistent with the Main Estimates and Supplementary Estimates for the 2016-17 fiscal year. This quarterly report has been prepared using a special purpose financial reporting framework designed to meet financial information needs with respect to the use of spending authorities.
The authority of Parliament is required before moneys can be spent by the Government. Approvals are given in the form of annually approved limits through appropriation acts or through legislation in the form of statutory spending authority for specific purposes.
The Agency uses the full accrual method of accounting to prepare and present its annual departmental financial statements that are part of the department performance reporting process. However, the spending authorities voted by Parliament remain on an expenditure basis.
2. Highlights of fiscal quarter and fiscal year to date results
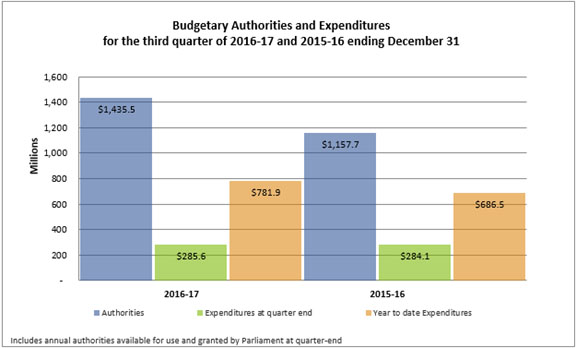
The above chart outlines the total authorities available within the Agency as of December 31 of each year, the expenditures during the third quarter as well as the year to date expenditures. Significant changes to authorities and to expenditure patterns are outlined in the following sections.
2.1 Statement of Authorities (Table 1)
Authorities available for use
This quarterly report reflects the funding available for use from the 2016-17 Main Estimates, the 2015-16 unused spending authorityFootnote 1, the 2016-17 Supplementary Estimates A and the 2016-17 Supplementary Estimates B. The authorities at the same time last year consisted of 2015-16 Main Estimates, the 2014-15 unused spending authority and the 2015-16 Supplementary Estimates A.
As per Table 1 (Statement of Authorities), at December 31, 2016, Parks Canada’s total authorities available for use for the year ending March 31, 2017 are $277.8 million or 24 percent higher when compared to the same quarter of the previous year (from $1,157.7M to $1,435.5M). The increase in authorities is due to the following factors:
- Unused spending authority in 2015-16 - $89.8 million;
- Investments in important federal infrastructure assets across the country, announced in Budget 2015 - $84.8 million;
- Investments to revitalize federal infrastructure assets as well as protect nationally significant cultural infrastructure, announced in Budget 2016 - $78.2 million;
- Developping programs and connecting Canadians to Canada’s heritage places in celebration of Canada 150 - $16.9 million;
- An increase in Budgetary statutory authorities related to expenditures equivalent to revenues - $9.9 million;
- A change in funding profile for Rouge National Urban Park due to delays in land transfer agreements - $7.7 million;
- Expansion of Parks Canada’s Young Canada Works program as part of the Youth Employment Strategy (Budget 2016) - $4.0 million; and
- Investments to develop and operate the Wrecks of HMS Erebus and HMS Terror National Historic Site - $3.1 million;
These increases are offset by the following decreases in the agency’s spending authorities:
- A reduction in authorities related to improvements to highways, bridges and dams located in national parks and along historic canals - $14.4 million; and
- A reduction in funding for Professional Services, Advertising and Travel, announced in Budget 2016 - $2.3 million.
Authorities used during the quarter
In the third quarter of 2016-17, total net budgetary expenditures were $285.6 million compared to $284.1 million reported for the same period in 2015-16, resulting in an increase of $1.5 million or 0.5 percent.
Year to date used
The year to date total budgetary expenditures were $781.9 million compared to $686.5 million reported at the same time last year, indicating an increase of $95.4 million or 13.9 percent. This increase is consistent with the ramp up of authorities in the Agency’s investment programs.
2.2 Budgetary Expenditures by Standard Object (Table 2)
Planned by Standard Object
Total planned expenditures in the third quarter of 2016-17 are $277.8 million or 24 percent higher compared to the previous year. This variance is mainly due to increases in Acquisition of land, buildings and works ($158.3M) and in Professional and special services ($108.7M). These increases are consistent with the ramp up of authorities mentioned in the Agency’s investments programs, as well as its unused spending authority from the previous fiscal year.
Expended by Standard Object
As per Table 2 (Budgetary Expenditures by Standard Object), the total expended in the third quarter ending December 31, 2016, is $1.5 million or 0.5-percent higher compared to the previous year, and the year to date expenditures have increased by $95.4 million or 13.9 percent. The overall increase can be explained by the following:
Acquisition of land, buildings and works year to date expenditures have increased by $43.5 million, Professional and special services have increased by $25.9 million and Personnel expenditures have increased by $15.6 million. These increases are consistent with the ramp up of authorities in the Agency investment programs identified above.
All other expenditures are consistent with prior year spending trends.
3. Risks and Uncertainties
Parks Canada’s objectives and Strategic Outcome are influenced by various internal and external factors. The Agency undertakes a risk assessment every year to support decision making related to priority setting and resource allocation. The risk assessment identifies key risks that have the greatest impact on the Agency’s ability to achieve its Strategic Outcome and expected results. The Agency has identified Environmental Forces Adaptation and Response, Infrastructure Project Delivery, Connecting with Canadians, External Development Pressures and Indigenous Relationships as its key corporate risks for 2016-17Footnote 2 . The following are examples of some of the mitigation strategies that Parks Canada is undertaking in order to address these risks:
- undertaking applicable planning and monitoring to identify potential threats to or at heritage places; continuing to identify best practices to reduce impacts of natural threats to cultural resources, such as shoreline erosion;
- implementing an Agency project management office to strengthening national project management practices, processes and controls that enable the Agency to achieve effective and prudent project delivery;
- developing and beginning the implementation of a plan for Parks Canada's participation in federal activities to celebrate the 150th anniversary of Canadian Confederation;
- continuing to undertake ecological restoration projects as part of the Conservation and Restoration Program to build ecosystem resilience; and
- Implementing Promising Pathways: A resource guide for strengthening engagement with Indigenous peoples.
4. Significant Changes in Relation to Operations, Personnel and Programs
Mitch Bloom joined the Parks Canada team on November 1st, 2016, as Vice-President, Strategic Policy and Investment.
5. Approval by Senior Officials
Approved by:
Daniel Watson
Chief Executive Officer, Parks Canada
Gatineau, Canada
February 28, 2016
Sylvain Michaud
Chief Financial Officer, Parks Canada
Gatineau, Canada
February 28, 2016
Parks Canada Agency
For the quarter ended December 31, 2016
Statement of Authorities - Table 1
(Unaudited)
| (in thousands of dollars) | Total available for use for the year ending March 31, 2017Footnote * | Used during the quarter ended December 31, 2016 | Year to date used at quarter end |
|---|---|---|---|
| Vote 1 - Program expenditures | 1,242,720 | 241,609 | 617,708 |
| Vote 5 - Payments to the New Parks and Historic Sites Account | 500 | 0 | 0 |
| Statutory - Contributions to employee benefit plans | 53,645 | 13,209 | 39,627 |
| Statutory - Expenditures equivalent to revenues resulting from the conduct of operations pursuant to section 20 of the Parks Canada Agency Act | 138,591 | 30,770 | 124,532 |
| Total budgetary expenditures | 1,435,456 | 285,588 | 781,867 |
| (in thousands of dollars) | Total available for use for the year ending March 31, 2016Footnote * | Used during the quarter ended December 31, 2015 | Year to date used at quarter end |
|---|---|---|---|
| Vote 1 - Program expenditures | 976,161 | 240,731 | 532,129 |
| Vote 5 - Payments to the New Parks and Historic Sites Account | 500 | 0 | 0 |
| Statutory - Contributions to employee benefit plans | 52,318 | 11,909 | 35,728 |
| Statutory - Expenditures equivalent to revenues resulting from the conduct of operations pursuant to section 20 of the Parks Canada Agency Act | 128,678 | 31,431 | 118,635 |
| Total budgetary expenditures | 1,157,657 | 284,071 | 686,492 |
Parks Canada Agency
For the quarter ended December 31, 2016
Budgetary Expenditures by Standard Object - Table 2
(Unaudited)
| (in thousands of dollars) | Planned expenditures for the year ending March 31, 2017Footnote * | Expended during the quarter ended December 31, 2016 | Year to date used at quarter end |
|---|---|---|---|
| Expenditures: | |||
| Personnel | 376,491 | 87,301 | 299,377 |
| Transportation and communications | 26,179 | 4,462 | 12,765 |
| Information | 13,476 | 1,081 | 3,969 |
| Professional and special services | 264,452 | 51,299 | 120,975 |
| Rentals | 39,724 | 4,670 | 14,466 |
| Repair and maintenance | 29,131 | 13,802 | 23,478 |
| Utilities, materials and supplies | 83,964 | 12,886 | 32,578 |
| Acquisition of land, buildings and works | 496,201 | 102,300 | 235,464 |
| Acquisition of machinery and equipment | 61,941 | 5,182 | 16,914 |
| Transfer payments | 24,037 | 2,016 | 4,642 |
| Other subsidies and payments | 19,860 | 589 | 17,239 |
| Total budgetary expenditures | 1,435,456 | 285,588 | 781,867 |
| (in thousands of dollars) | Planned expenditures for the year ending March 31, 2016Footnote * | Expended during the quarter ended December 31, 2015 | Year to date used at quarter end |
|---|---|---|---|
| Expenditures: | |||
| Personnel | 374,973 | 86,262 | 283,740 |
| Transportation and communications | 18,655 | 4,665 | 11,516 |
| Information | 10,341 | 1,267 | 4,217 |
| Professional and special services | 155,764 | 49,877 | 95,117 |
| Rentals | 23,134 | 6,093 | 18,492 |
| Repair and maintenance | 102,420 | 7,156 | 18,943 |
| Utilities, materials and supplies | 57,393 | 11,545 | 30,001 |
| Acquisition of land, buildings and works | 337,931 | 108,328 | 192,002 |
| Acquisition of machinery and equipment | 41,178 | 6,330 | 14,692 |
| Transfer payments | 19,058 | 881 | 5,087 |
| Other subsidies and payments | 16,810 | 1,667 | 12,685 |
| Total budgetary expenditures | 1,157,657 | 284,071 | 686,492 |
Related links
- Quarterly financial report for the quarter ended December...
- Quarterly financial report for the quarter ended September...
- Quarterly financial report for the quarter ended June 30,...
- Quarterly financial report for the quarter ended December...
- Quarterly financial report for the quarter ended September...
- Quarterly financial report for the quarter ended June 30,...
- Quarterly financial report for the quarter ended June 30,...
- Quarterly financial report for the quarter ended September...
- Quarterly financial report for the quarter ended December...
- Date modified :