
Climate summary
Wapusk National Park
About Wapusk National Park
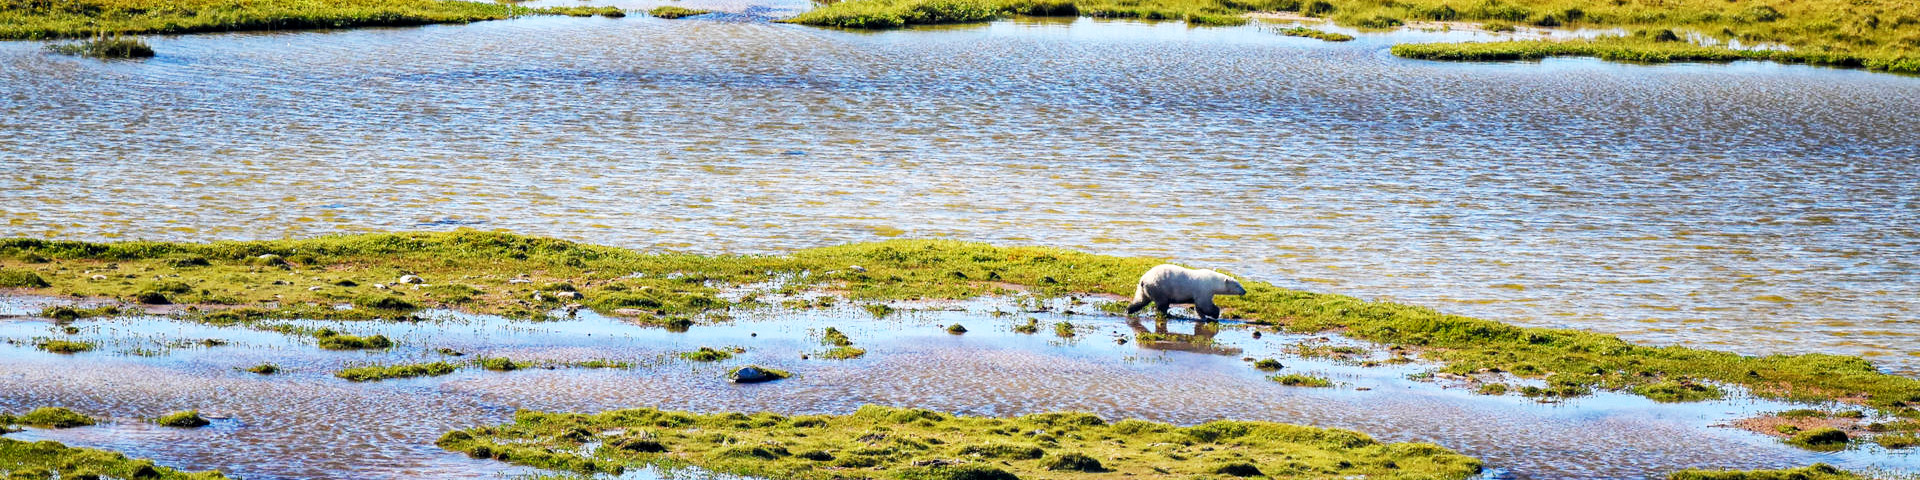
Wapusk National Park is located on the shores of Hudson Bay in northeast Manitoba. It is on Treaty 5 territory, lands traditionally used by the Cree, Dene, Inuit, and Red River Métis peoples. The park represents the Hudson-James Bay Lowlands (HBL) region; a landscape of ecological transition between boreal forest and arctic tundra, and between freshwater and marine waters. The vast peatlands of the park play an important role in carbon sequestration and are dotted with shallow tundra pools that contribute to the broad diversity of habitats. Wapusk National Park protects one of the largest polar bear maternity denning areas in the world and the calving grounds for the Cape Churchill caribou herd. The site is also a major migratory stopover for more than 200 species of birds.
Elevation range: 0 to 86 m
Area: 11,475 km2
Latitude: 58.7°N
Longitude: 93.2°W
Changes in Temperature
Wapusk National Park, much like the rest of Canada, is warming faster than the global average. If emissions continue to increase at the current rate, then by 2051-2080 the average annual temperature in the park is projected to increase by about 4 to 6 degrees relative to the recent past. The effects of a warming climate include warmer average temperatures, more extreme heat days, and fewer days below zero per year. While rising temperatures contribute to sea level rise, the impact in Wapusk National Park is expected to be minimal as the land continues to rise due to isostatic rebound. Under a high emission scenario, relative sea level is projected to increase by only about 8 cm by 2070. In addition to influencing regional rates of sea-level rise, a warmer climate will likely intensify some weather extremes, increasing the severity of heatwaves, droughts and wildfires due to the increase in summer temperatures with no corresponding increase in summer precipitation. Additionally, warmer temperatures will reduce the duration and extent of marine and freshwater ice cover.
Changes in Precipitation and Water Availability
Within Wapusk National Park, total annual precipitation is projected to increase. However, changes in precipitation are not consistent across seasons, with the greatest increase occurring in the winter months and relatively no change in summer precipitation. Models also project an increase in precipitation extremes (e.g. heavy precipitation events) over that same time period. For example, the maximum amount of rainfall over a 5-day period is expected to increase by 18% under a high-emission scenario, relative to the recent past. Seasonal changes in temperature and precipitation (see the Climograph,) will likely combine to affect snowpack depth and duration, permafrost thaw, stream flows and wetland and lake levels. For example, rising winter temperatures can cause more precipitation to fall as rain rather than snow and shift the timing, duration, and magnitude of peak stream flows in spring.
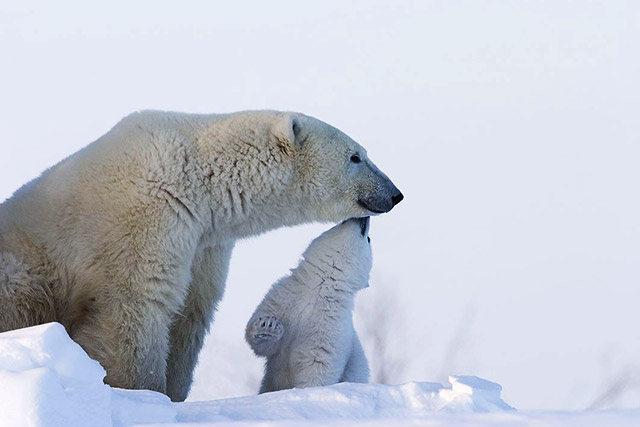
Photo: © Thorston Milse. All rights reserved.
Spotlight on Impacts: Climate Change and Polar Bears
Climate change is reducing sea ice habitat, posing a serious challenge for polar bears. In western Hudson Bay, the ice-free season has lengthened by nearly a month since the 1980s, giving polar bears less time to hunt ice-breeding seals and build the fat reserves they need to survive and raise young. Pregnant females in Wapusk National Park are especially affected, as they rely on these reserves during up to eight months in dens. However, ongoing knowledge gathering is helping us better understand how polar bears are adapting.
Projected climate values for Wapusk National Park
|
Variable |
Recent Past1 1961-1990 |
Moderate Emission Future2 2051-2080 |
High Emission Future2 2051-2080 |
|
Average annual temperature |
-5.8 oC (-6.1 – -5.6) |
-1.5 oC (-2.3 – 0.9) |
0.3 oC (-0.9 – 2.7) |
|
Days above 25oC |
7 (5 – 8) |
20 (15 – 33) |
27 (20 – 46) |
|
Ice days3 |
183 (181 – 185) |
161 (149 – 167) |
152 (136 – 162) |
|
Total precipitation |
522 mm (511 – 530) |
594 mm (552 – 631) |
606 mm (586 – 676) |
|
Wet days > 1mm4 |
140 (137 – 143) |
155 (146 – 171) |
160 (149 – 181) |
|
Growing degree days (5oC)5 |
705 (665 – 732) |
1145 (1003 – 1448) |
1370 (1156 – 1670) |
|
Frost free season (days) |
87 (83 – 90) |
119 (104 – 136) |
130 (113 – 152) |
|
Freeze-thaw cycles |
47 (45 – 48) |
43 (39 – 52) |
43 (38 – 52) |
Larger values denote the median of an ensemble of 26 climate models; values in brackets denote the 10th and 90th percentile values.
1 The recent past was computed using historical model simulations.
2 The ‘moderate emission future’ refers to SSP2-4.5 and ‘high emission future’ refers to SSP5-8.5. SSP1-2.6 is another scenario that describes warming under much lower emissions.
3 The number of days when the daily maximum temperature does not exceed 0 °C.
4 The number of days with daily precipitation totals greater than 1 mm.
5 Growing degree days (GDD) provide an index of the amount of heat available for the growth of plants and insects. GDD accumulate whenever the daily mean temperature is above 5 °C.
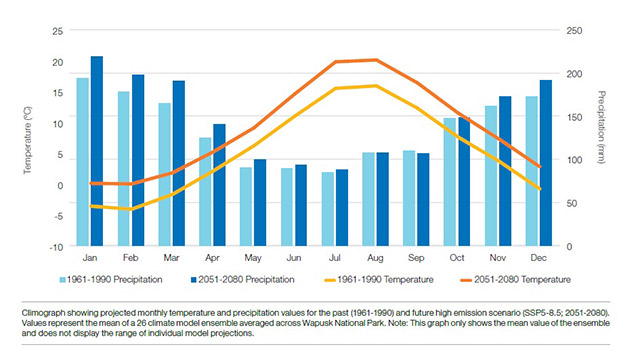
Image description
The climograph shows that the temperature increases in the summer months, peaking in August, and decreases in the winter months, bottoming in February. Precipitation ranges from 85 to 194mm throughout the year. Compared to the 1961-1990 time period, temperature ranges between 3 - 4 degrees higher in the 2051-2080 time period, with the biggest difference in July indicating the most significant warming happening in the summer. Compared to the 1961-1990 time period, precipitation levels are also up to 26mm higher in the 2051-2080 time period.
Looking Toward the Future
The amount of future warming we experience depends on the concentration of greenhouse gases in the atmosphere. To account for future emissions uncertainty, climate models are run using different scenarios, called Shared Socioeconomic Pathways (SSPs). SSP1-2.6 is a low emission scenario characterized by rapid emissions reductions and policy focused on sustainable development. In this scenario, emissions peak around 2020 and decline to zero near mid-century. In the moderate SSP2-4.5 scenario, socioeconomic development continues to follow current patterns and emissions peak around 2050 then decline. SSP5-8.5 represents a very high emission scenario characterized by further fossil-fuel driven economic development. In this scenario, emissions rise throughout the century.
About the Data
As per standard practice, the data in this report comes from an ensemble of 26 CMIP6 global climate models that have been downscaled to 6 km by 10 km using the MBCn method. Values have been spatially averaged across the park and temporally averaged over two 30-year time periods (1961-1990 and 2051-2080). The summary table on the reverse page displays the median, 10th and 90th percentile values of the climate model ensemble, which helps demonstrate the range in model projections. For a full description of the data and modeling methodology, and to download additional data, visit ClimateData.ca.
Based on Natural Resources Canada data, Relative Sea Level Change projections are by decade (2010 – 2100) relative to 1986 – 2005 conditions.
Potential Climate Change Impacts and Adaptation Responses
Climate change will affect all programs under Parks Canada’s mandate. There are many likely impacts associated with projected future climate conditions at Wapusk National Park. The table below outlines some examples of these projected conditions and impacts, as well as potential options for adaptation responses. Parks Canada works with Indigenous partners to develop and implement climate change adaptation responses. Parks Canada uses information like this, along with Indigenous knowledge, to better manage operations in national historic sites, national parks, and national marine conservation areas, as well as the services offered to visitors.
At Wapusk National Park, this collaboration is guided by the Wapusk Management Board, which helps respectfully weave Indigenous Knowledge into decision-making across the program areas described in the table.
|
Parks Canada Program Area |
Future Climate Condition |
Example of likely impact |
Example of potential adaptation response |
|
Natural Heritage |
Increased temperatures |
Species range shifts |
Map changes in species distribution and abundance to inform conservation planning |
|
Cultural Heritage |
Permafrost melt and degradation |
Cultural resources are damaged or lost due to changing permafrost conditions |
Continue to document cultural resources at risk of being damaged or lost to maintain knowledge of cultural heritage |
|
Visitor Experience |
Shifting seasons |
Seasonal changes further complicate access to this already remote park |
Provide alternate activities at the Visitor Centre in Churchill to engage and educate visitors around climate change impacts |
|
Health, Safety & Wellness |
Increased temperatures (loss of sea-ice) |
Increase in human-wildlife conflicts |
Ensure visitors and staff are aware of risks and strengthen capacity to respond to human-wildlife conflicts |
|
Built Assets |
Increased storm severity |
Increased damage to research compounds and infrastructure |
Consider the impacts of climate change when developing asset management plans |
Acknowledgment
We thank ClimateData.ca and PAVICS for providing the climate data used in this document. For further details on climate projections, please visit ClimateData.ca.
For information about this Climate Summary, contact us at:
changementclimatique-climatechange@pc.gc.ca
Disclaimer: His Majesty the King in right of Canada, as represented by the Minister of Canadian Identity and Culture and Minister responsible for Official Languages, does not warrant or guarantee the accuracy or completeness of the information (“Data”) on this resource and does not assume any responsibility or liability with respect to any damage or loss arising from the use or interpretation of the Data.
- Date modified :