
Quarterly financial report for the quarter ended September 30, 2017
1. Introduction
This quarterly report has been prepared by management as required by section 65.1 of the Financial Administration Act and in the form and manner prescribed by the Treasury Board. This report should be read in conjunction with the Main Estimates, the Supplementary Estimates and the previous Quarterly Financial Reports.
A summary description of the Parks Canada Agency’s programs can be found in Part II of the Main Estimates, and a detailed description in Part III – Departmental Plans.
This quarterly report has not been subject to an external audit. However, it has been reviewed by the Agency’s Audit Committee.
1.1 Basis of Presentation
This quarterly report has been prepared using an expenditure basis of accounting (modified cash accounting). The accompanying Statement of Authorities includes the Parks Canada Agency’s spending authorities granted by Parliament and those used by the Agency consistent with the Main Estimates and Supplementary Estimates for the 2017-18 fiscal year. This quarterly report has been prepared using a special purpose financial reporting framework designed to meet financial information needs with respect to the use of spending authorities.
The authority of Parliament is required before moneys can be spent by the Government. Approvals are given in the form of annually approved limits through appropriation acts or through legislation in the form of statutory spending authority for specific purposes.
The Agency uses the full accrual method of accounting to prepare and present its annual departmental financial statements that are part of the department performance reporting process. However, the spending authorities voted by Parliament remain on an expenditure basis.
2. Highlights of fiscal quarter and fiscal year to date results
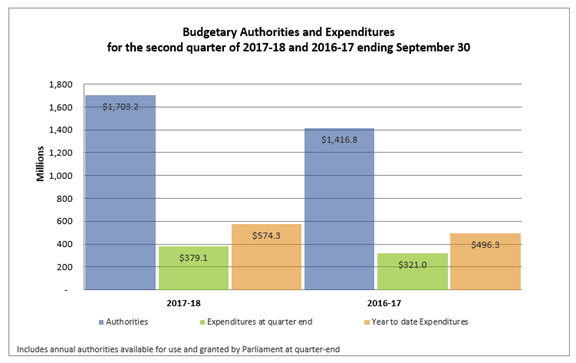
The above chart outlines the total authorities available within the Agency as of September 30 of each year, the expenditures during the second quarter as well as the year to date expenditures. Significant changes to authorities and to expenditure patterns are outlined in the following sections.
2.1 Statement of Authorities (Table 1)
Authorities available for use
This quarterly report reflects the funding available for use from the 2017-18 Main Estimates, the 2016-17 unused spending authorityFootnote 1 and the 2017-18 Supplementary Estimates A. The authorities at the same time last year consisted of 2016-17 Main Estimates, the 2015-16 unused spending authority and the 2016-17 Supplementary Estimates A.
As per Table 1 (Statement of Authorities), at September 30, 2017, Parks Canada’s total authorities available for use for the year ending March 31, 2018, are $286.4 million or 20 percent higher when compared to the same quarter of the previous year (from $1,416.8M to $1,703.2M). The increase in authorities is primarily due to the following factors:
- Increase in unused spending authority in 2016-17 as compared to 2015-16 - $112.2 million;
- Investments in federal infrastructure assets across the country to address the backlog of deferred work for heritage, tourism, highway and waterway built assets, announced in Budget 2015 - $100.8 million;
- Developing programs and connecting Canadians to Canada’s heritage places in celebration of Canada 150 - $65.6 million;
- Investments in trails and highways in national parks, announced in Budget 2016 - $64.2 million;
- Funding received for a settlement in regards to a payment in lieu of taxes related to the Halifax Citadel National Historic Site - $20.0 million;
- Expansion of Parks Canada’s Young Canada Works program as part of the renewed youth employment strategy - $11.0 million; and
- New funding to expand the national park and national marine conservation area systems - $7.6 million.
These increases are offset by the following decreases in the agency’s spending authorities:
- A reduction in authorities for improvements to highways, bridges and dams located in national parks and along historic canals, announced in Budget 2014 - $46.6 million;
- A reduction in the Agency’s statutory authority of expenditures equivalent to revenues as a result of free entry to all visitors to national parks, national marine conservation areas and national historic sites in celebration of Canada 150 (this reduction is offset by an increase in voted authorities mentioned above) - $42.0 million; and
- The sunsetting of funding to support the Trans Canada Trail Foundation’s Fundraising Campaign - $6.3 million.
Authorities used during the quarter
In the second quarter of 2017-18, total net budgetary expenditures were $379.1 million compared to $321.0 million reported for the same period in 2016-17, resulting in an increase of $58.1 million or 18 percent. The increase in authorities used during the quarter is primarily related to the Agency’s infrastructure investment program, increased staffing to support Canada 150 activities, the expansion of Parks Canada’s Young Canada Works program and increased expenditures in the fire management program due to a series of record-breaking wildfires in British Columbia and Alberta.
2.2 Budgetary Expenditures by Standard Object (Table 2)
Planned by Standard Object
Total planned expenditures in the second quarter of 2017-18 are $286.4 million or 20 percent higher compared to the previous year. This variance is primarily due to increases in Professional and special services ($111.1M), in Acquisition of land, buildings and works ($108.8M), and in Other subsidies and payments ($23.6M). These increases are consistent with the ramp up of authorities in the Agency’s infrastructure investment program, as well as an increase in authorities from unused spending authority from the previous fiscal year.
Expended by Standard Object
As per Table 2 (Budgetary Expenditures by Standard Object), the total expended in the second quarter ending September 30, 2017, is $58.1 million or 18 percent higher compared to the previous year. The overall increase can be explained by the following:
Acquisition of land, buildings and works expenditures have increased by $24.2 million and Professional and special services expenditures have increased by $14.2 million compared to the same quarter last year. The increase in expenditures is consistent with the increase in funding in the Agency’s infrastructure investment program.
Personnel expenditures have increased by $7.0 million compared to the same quarter last year. This increase is primarily due to temporarily increased staffing in order to support Canada 150 activities, as well as the expansion of Parks Canada’s Young Canada Works program, with nearly twice the amount of students hired compared to last year.
All other expenditures are consistent with prior year spending trends.
3. Risks and Uncertainties
Parks Canada's objectives and Strategic Outcome are influenced by various internal and external factors. The Agency undertakes a risk assessment every year to support decision making related to priority setting and resource allocation. The risk assessment identifies key risks that have the greatest impact on the Agency's ability to achieve its Strategic Outcome and expected results. The Agency has identified the following key corporate risks for 2017-18:
- Environmental forces adaptation and response;
- Built asset condition and long-term sustainability;
- Connecting with Canadians;
- External development pressures; and
- Indigenous peoples’ reconciliation.
4. Significant Changes in Relation to Operations, Personnel and Programs
There are no significant changes in relation to operations, personnel and programs to report during this quarter.
5. Approval by Senior Officials
Approved by:
Daniel Watson
Chief Executive Officer, Parks Canada
Gatineau, Canada
November 23, 2017
Sylvain Michaud
Chief Financial Officer, Parks Canada
Gatineau, Canada
November 23, 2017
Parks Canada Agency
For the quarter ended September 30, 2017
Statement of Authorities - Table 1
(Unaudited)
| (in thousands of dollars) | Total available for use for the year ending March 31, 2018Footnote * | Used during the quarter ended September 30, 2017 | Year to date used at quarter end |
|---|---|---|---|
| Vote 1 - Program expenditures | 1,554,014 | 341,981 | 503,728 |
| Vote 5 - Payments to the New Parks and Historic Sites Account | 500 | 0 | 0 |
| Statutory - Contributions to employee benefit plans | 49,481 | 12,328 | 24,656 |
| Statutory - Expenditures equivalent to revenues resulting from the conduct of operations pursuant to section 20 of the Parks Canada Agency Act | 99,232 | 24,808 | 45,882 |
| Total budgetary authorities | 1,703,227 | 379,116 | 574,267 |
| (in thousands of dollars) | Total available for use for the year ending March 31, 2017Footnote * | Used during the quarter ended September 30, 2016 | Year to date used at quarter end |
|---|---|---|---|
| Vote 1 - Program expenditures | 1,224,473 | 245,109 | 376,099 |
| Vote 5 - Payments to the New Parks and Historic Sites Account | 500 | 0 | 0 |
| Statutory - Contributions to employee benefit plans | 53,230 | 13,209 | 26,418 |
| Statutory - Expenditures equivalent to revenues resulting from the conduct of operations pursuant to section 20 of the Parks Canada Agency Act | 138,591 | 62,703 | 93,762 |
| Total budgetary authorities | 1,416,794 | 321,021 | 496,279 |
Parks Canada Agency
For the quarter ended September 30, 2017
Budgetary Expenditures by Standard Object - Table 2
(Unaudited)
| (in thousands of dollars) | Planned expenditures for the year ending March 31, 2018Footnote * | Expended during the quarter ended September 30, 2017 | Year to date used at quarter end |
|---|---|---|---|
| Expenditures: | |||
| Personnel | 376,476 | 123,538 | 227,587 |
| Transportation and communications | 37,746 | 6,722 | 11,179 |
| Information | 16,830 | 2,093 | 3,416 |
| Professional and special services | 372,137 | 63,433 | 85,380 |
| Rentals | 34,075 | 11,566 | 15,299 |
| Repair and maintenance | 42,698 | 11,323 | 17,041 |
| Utilities, materials and supplies | 93,055 | 14,531 | 21,773 |
| Acquisition of land, buildings and works | 604,696 | 126,633 | 165,714 |
| Acquisition of machinery and equipment | 62,704 | 5,502 | 9,754 |
| Transfer payments | 23,244 | 1,446 | 1,853 |
| Other subsidies and payments | 39,566 | 12,329 | 15,271 |
| Total budgetary expenditures | 1,703,227 | 379,116 | 574,267 |
| (in thousands of dollars) | Planned expenditures for the year ending March 31, 2017Footnote * | Expended during the quarter ended September 30, 2016 | Year to date used at quarter end |
|---|---|---|---|
| Expenditures: | |||
| Personnel | 375,920 | 116,474 | 212,076 |
| Transportation and communications | 24,044 | 4,700 | 8,303 |
| Information | 11,469 | 1,648 | 2,888 |
| Professional and special services | 261,011 | 49,248 | 69,676 |
| Rentals | 39,080 | 6,912 | 9,796 |
| Repair and maintenance | 28,402 | 7,267 | 9,676 |
| Utilities, materials and supplies | 80,305 | 13,411 | 19,692 |
| Acquisition of land, buildings and works | 495,850 | 102,402 | 133,164 |
| Acquisition of machinery and equipment | 61,042 | 6,544 | 11,732 |
| Transfer payments | 23,658 | 2,177 | 2,626 |
| Other subsidies and payments | 16,013 | 10,238 | 16,650 |
| Total budgetary expenditures | 1,416,794 | 321,021 | 496,279 |
Related links
- Quarterly financial report for the quarter ended December...
- Quarterly financial report for the quarter ended September...
- Quarterly financial report for the quarter ended June 30,...
- Quarterly financial report for the quarter ended December...
- Quarterly financial report for the quarter ended September...
- Quarterly financial report for the quarter ended June 30,...
- Quarterly financial report for the quarter ended June 30,...
- Quarterly financial report for the quarter ended September...
- Quarterly financial report for the quarter ended December...
- Date modified :