What We Heard:
Lake Louise Area Visitor Use Management — Phase 2: Draft Strategies and Actions
Banff National Park
- What We Heard: Lake Louise Area Visitor Use Management Report — Phase 2: Draft Strategies and Actions (PDF, 2.1 Mb)
An executive summary of this report is also available
View the executive summary version.
Sections:
Cette publication est aussi disponible en français.
Foreword
Since 2010, visitation to Banff National Park increased by 34% to a record 4.5 million visitors in 2025. This has led to congestion issues in the Lake Louise area affecting access, ecological integrity, overall enjoyment, and requiring active management to address public safety risks.
This rise has been more pronounced in the Lake Louise area with traffic volumes on Lake Louise Drive increasing 70% between 2010 and 2019, peaking at 2.1 million vehicles in 2019. In summer 2025, approximately 1,000 personal vehicles a day secured parking at Upper Lake Louise, while 75% of all vehicle traffic was turned away. Shuttle congestion at Moraine Lake resulted in long line-ups and conflict. Parks Canada must manage impacts on roads and parking lots, trails and viewpoints, lakes and rivers, wildlife and vegetation, facilities and emergency access.
With visitor and vehicle volumes expected to grow, Parks Canada is creating a visitor use management plan for the Lake Louise area. This work is guided by the internationally recognized Visitor Use Management (VUM) framework, as well as the 2022 Banff National Park Management Plan. In managing national parks, Parks Canada is mandated to restore ecological integrity while providing all Canadians with opportunities to discover and enjoy these special places.
Back to topContext
From February 3 to March 9, 2026, Parks Canada asked for feedback on a set of proposed visitor use management strategies and actions to help achieve desired conditions. Feedback was solicited through three public surveys at LetsTalkMountainParks.ca:
- Survey 1 - proposed general strategies and actions applicable to the entire Lake Louise project area.
- Survey 2 - proposed strategies and actions applicable to Upper Lake Louise (the lakeshore).
- Survey 3- proposed strategies and actions applicable to Moraine Lake and Paradise Valley.
The surveys included a combination of 5-point Likert scales (1-5), open-ended questions and one ranking question. Each survey was intended to take 15 minutes or less to complete. Questions were designed to assess the proposed strategies and actions for:
- the perceived effectiveness to achieve the desired conditions;
- level of support;
- concerns, comments and suggested alternatives.
Who we heard from
Number of Respondents
Over 10,000 users visited the project webpage. A total of 1,697 responses were received across all three surveys. Participants may have completed one, two or all the surveys. Five email responses were also submitted and coded along with the surveys.
- Survey 1 = 755 responses
- Survey 2 = 538 responses
- Survey 3 = 404 responses
Place of Residence
While the vast majority of survey respondents were Alberta residents, this is not representative of recent visitation demographics to Banff National Park or the Lake Louise area. It is worth noting that regional and local respondents’ views are overrepresented in the unweighted data and may not represent the views of all visitors.
Nearly three quarters of respondents were either residents of the Bow Valley including Lake Louise, Banff, Canmore, Exshaw (26-32%), or lived in or around Calgary (40-44%) including Airdrie, Cochrane, and Okotoks. The remainder of the respondents lived elsewhere in Alberta (12-14%), Canada (12-14%) or internationally (2-3%). Respondents from the Bow Valley, Calgary, elsewhere in Alberta and parts of BC often saw themselves as ‘local’ to the Lake Louise area regardless of their place of residence.
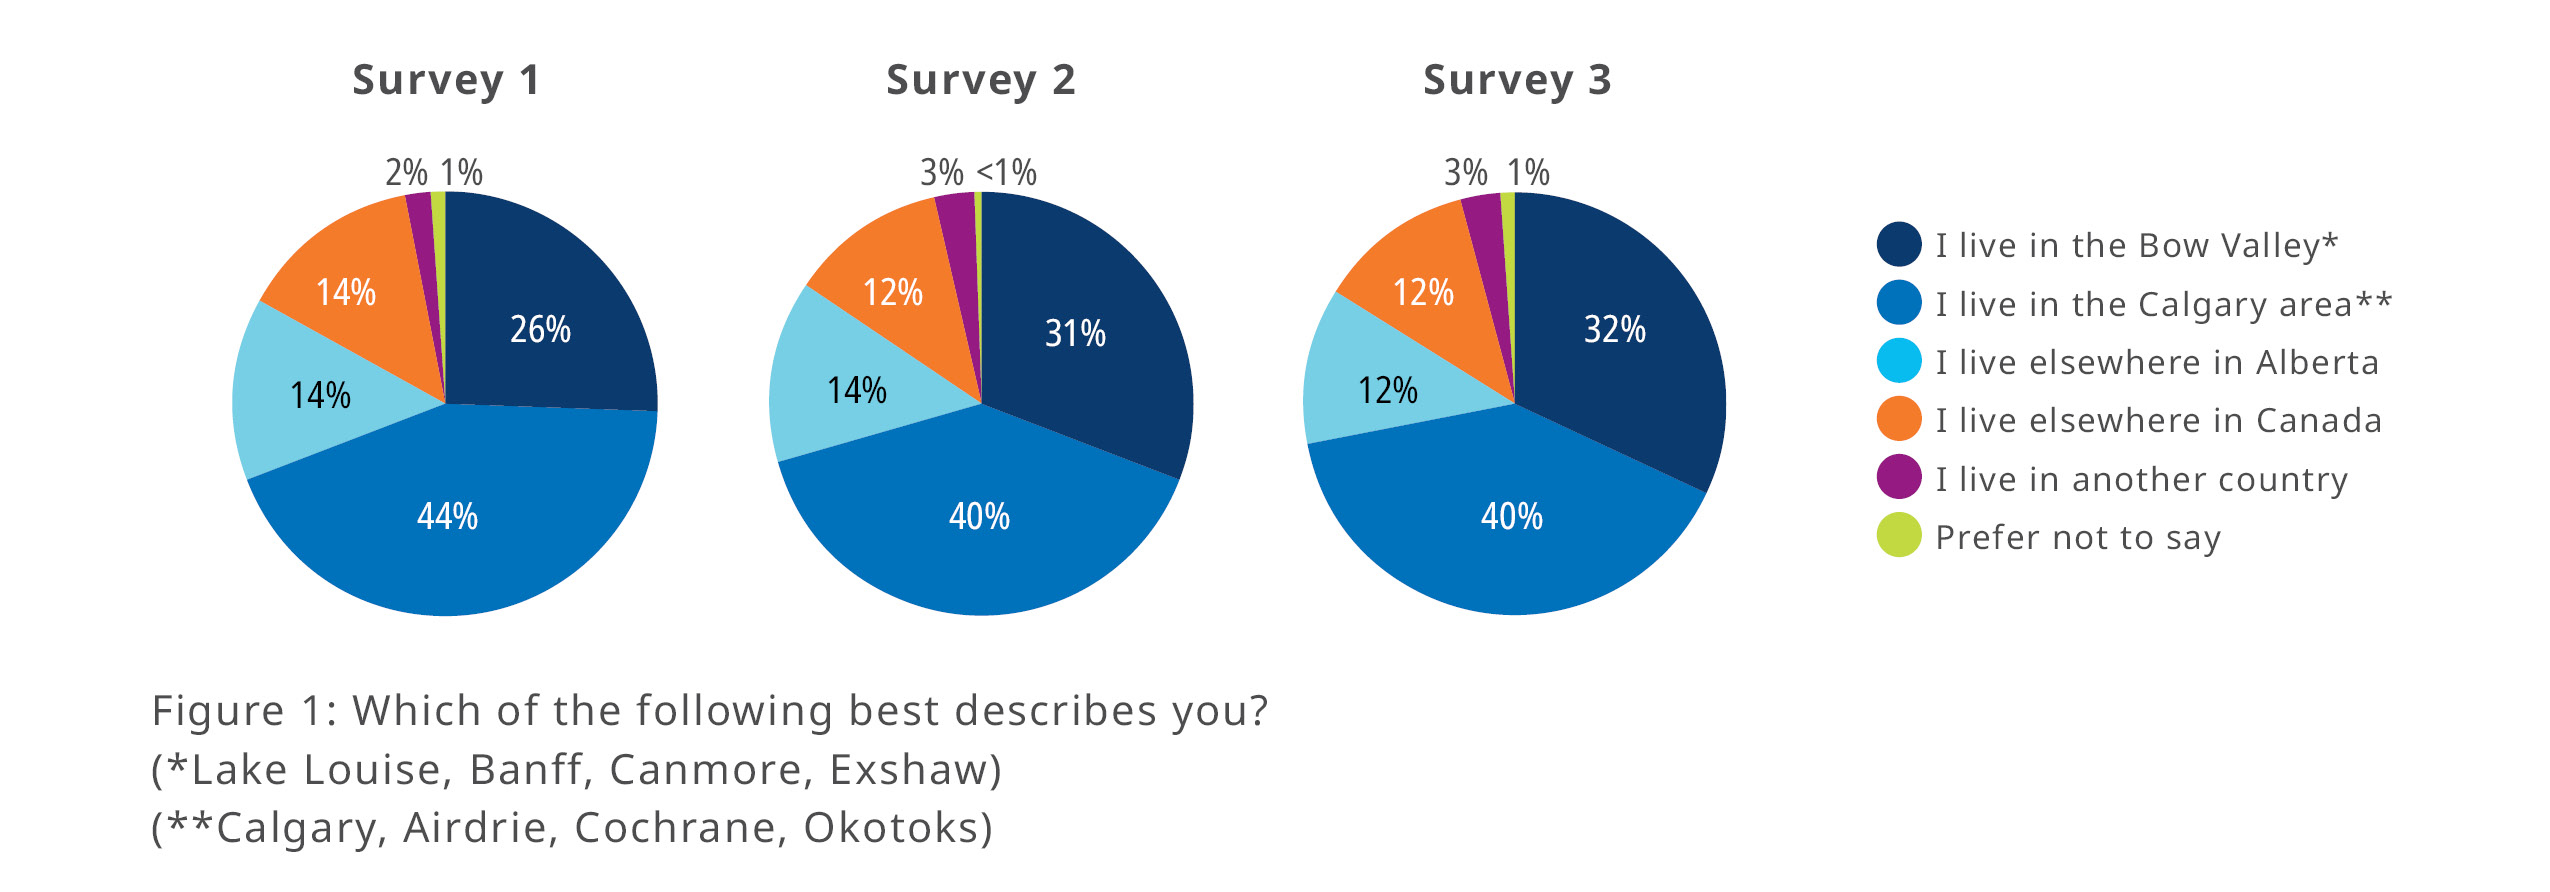
Figure 1: Which of the following best describes you? (*Lake Louise, Banff, Canmore, Exshaw) (**Calgary, Airdrie, Cochrane, Okotoks)
Survey 1: General strategies throughout the Lake Louise area
- I live in the Bow Valley* 26%
- I live in the Calgary area** 44%
- I live elsewhere in Alberta 14%
- I live else where in Canada 14%
- I live in another country 2%
- Prefer not to say 1%
Survey 2: Upper Lake Louise
- I live in the Bow Valley* 31%
- I live in the Calgary area** 40%
- I live elsewhere in Alberta 14%
- I live else where in Canada 12%
- I live in another country 3%
- Prefer not to say less than 1%
Survey 3: Moraine Lake and Paradise Valley
- I live in the Bow Valley* 32%
- I live in the Calgary area** 40%
- I live elsewhere in Alberta 12%
- I live else where in Canada 12%
- I live in another country 3%
- Prefer not to say 1%
Visitation
Within the last year, 64% of all respondents had visited the Lake Louise area and 65% had visited Upper Lake Louise. Respondents from the Bow Valley were more likely to have visited recently with 85% indicating they had visited within the past year, significantly higher than respondents from the Calgary area (63%), other Alberta residents (49%), or other Canadians (50%).
Moraine Lake had fewer visits in the last year but 70% of respondents still visited less than three years ago. At Paradise Valley, only 40% of respondents had visited less than three years ago and nearly one quarter (23%) had never visited.
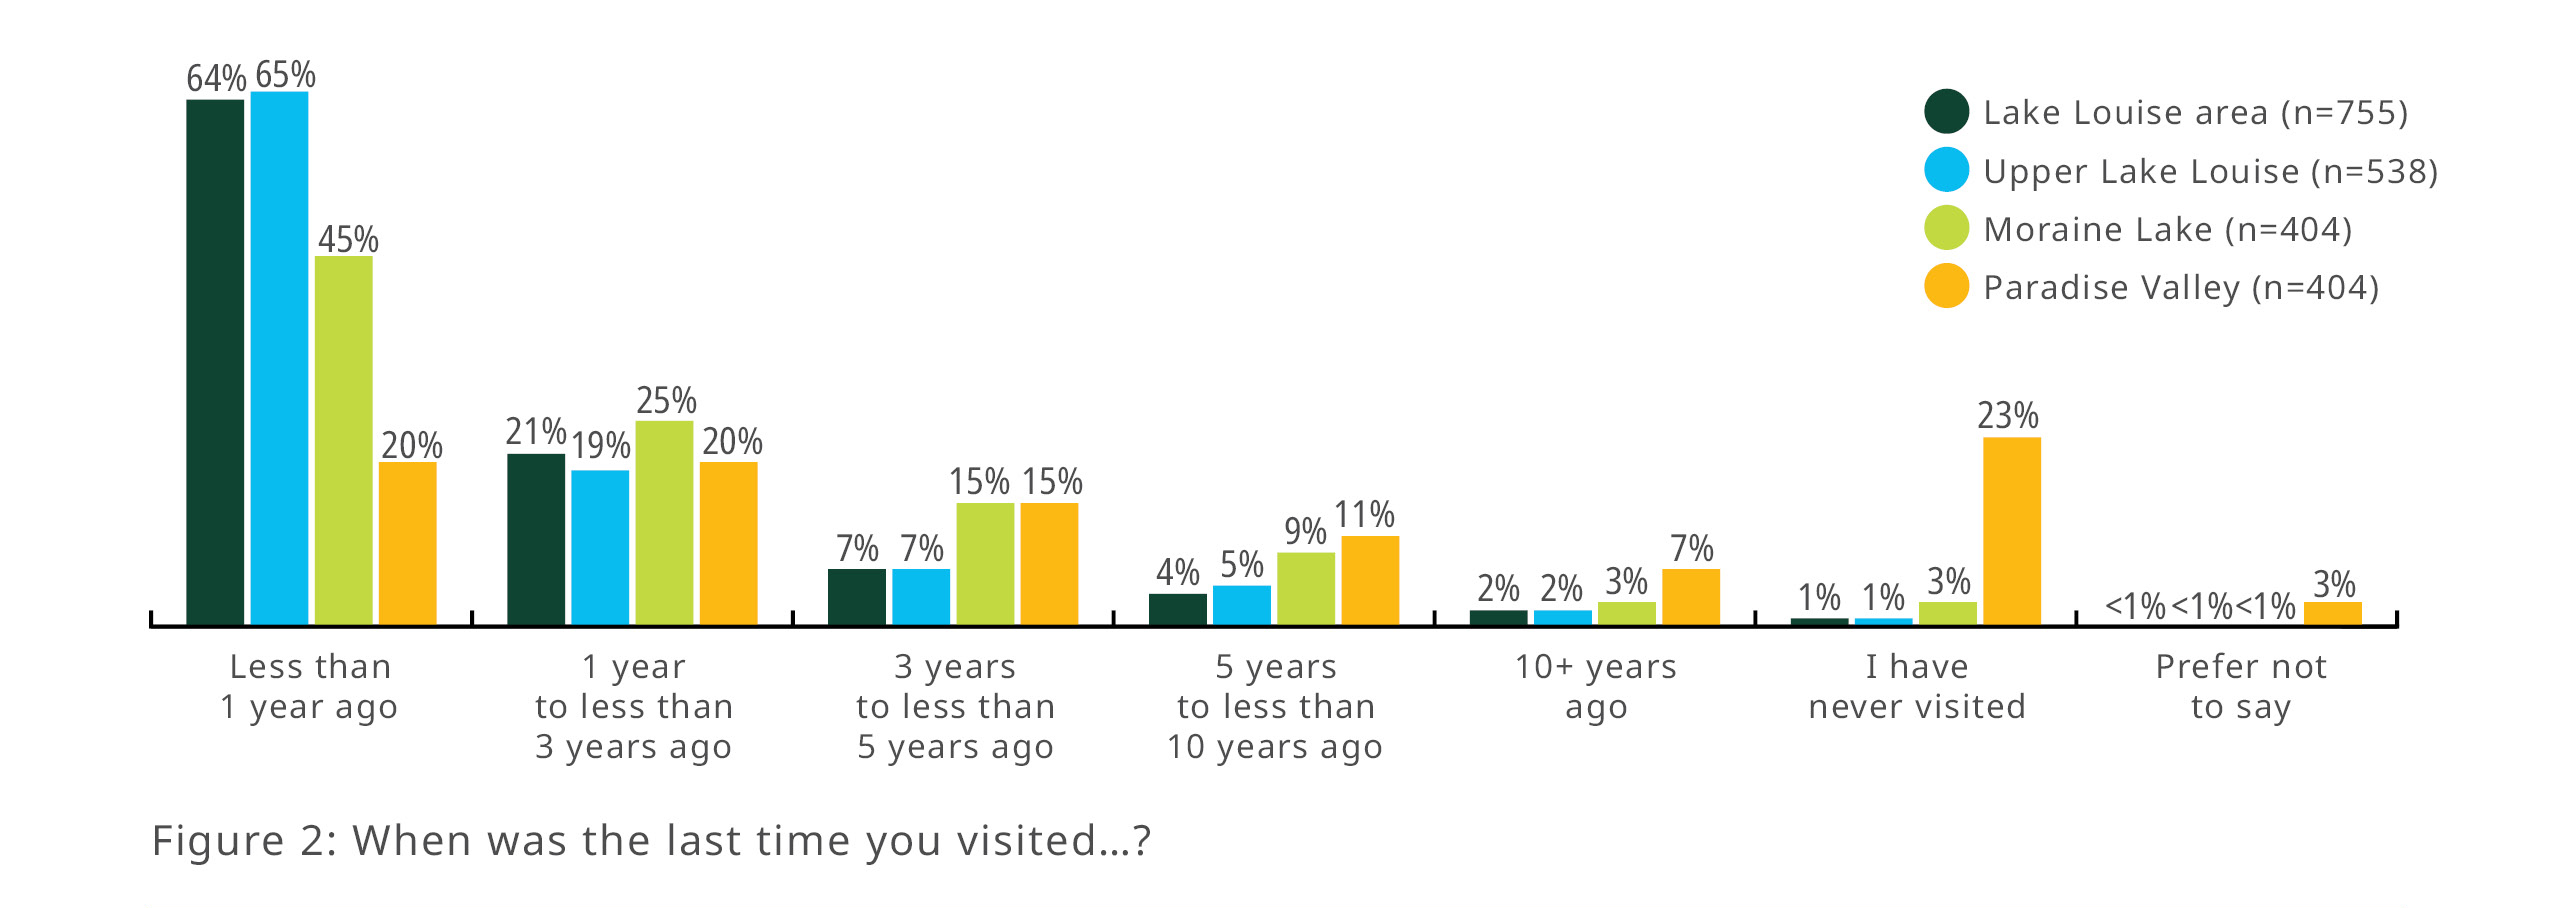
Figure 2: When was the last time you visited…?
Lake Louise area (n=755)
- Less than 1 year ago 64%
- 1 year to less than 3 years ago 21%
- 3 years to less then 5 years ago 7%
- 5 years to less than 10 years ago 4%
- 10+ years ago 2%
- I have never visited 1%
- Prefer not to say <1%
Upper Lake Louise (n=538)
- Less than 1 year ago 65%
- 1 year to less than 3 years ago 19%
- 3 years to less then 5 years ago 7%
- 5 years to less than 10 years ago 5%
- 10+ years ago 2%
- I have never visited 1%
- Prefer not to say less than 1%
Moraine Lake (n=404)
- Less than 1 year ago 45%
- 1 year to less than 3 years ago 25%
- 3 years to less then 5 years ago 15%
- 5 years to less than 10 years ago 9%
- 10+ years ago 3%
- I have never visited 3%
- Prefer not to say less than 1%
Paradise Valley (n=404)
- Less than 1 year ago 20%
- 1 year to less than 3 years ago 20%
- 3 years to less then 5 years ago 15%
- 5 years to less than 10 years ago 11%
- 10+ years ago 7%
- I have never visited 23%
- Prefer not to say 3%
Transportation
Most survey respondents who had visited the Lake Louise area or Upper Lake Louise had arrived by personal or rental vehicle. Parks Canada 2024 data indicated that 87% of visitors arrive to the park in personal or rental vehicles, and 34% use public transit and shuttles to access areas within the park. Visitation data from 2025 indicated that approximately 3,100 visitors daily arrive to Upper Lake Louise in personal or rental vehicles and 2,300 on shuttles.
Survey respondents who visited Moraine Lake recently were more likely to have used Parks Canada shuttles. Today, more than 97% of visitors to Moraine Lake arrive by public or private mass transit due to personal vehicles restrictions on Moraine Lake Road introduced in 2023.
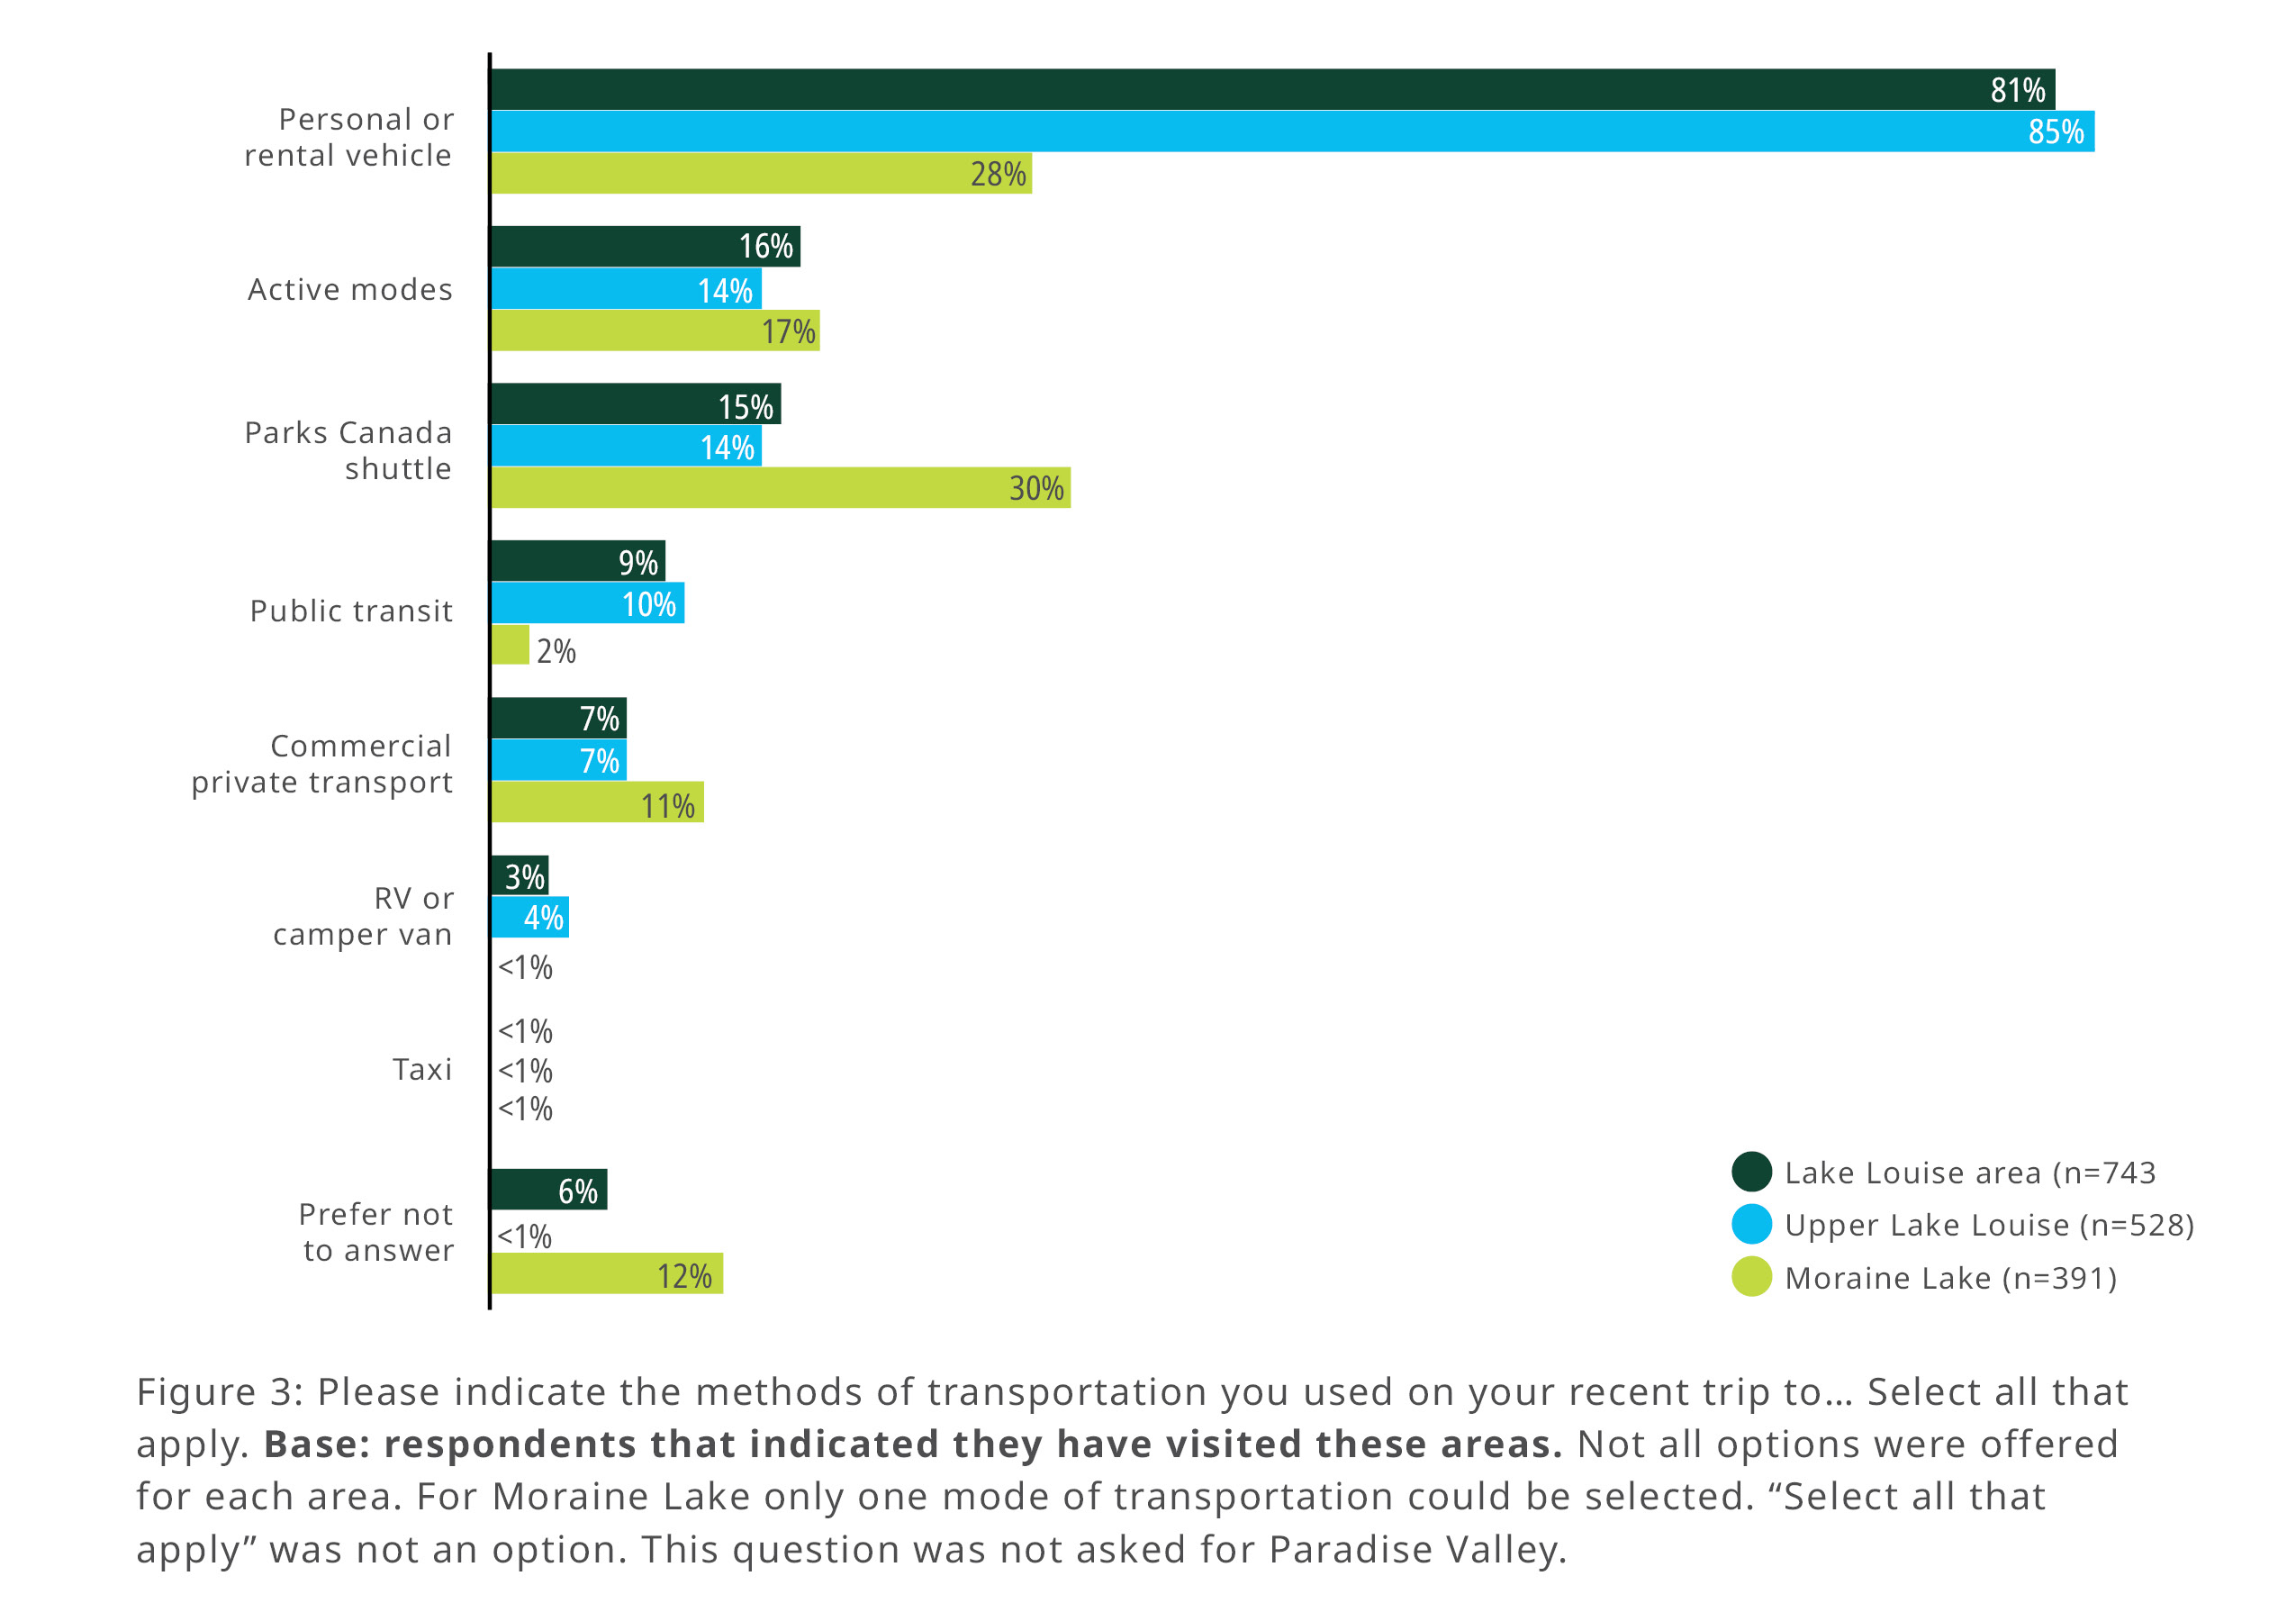
Figure 3: Please indicate the methods of transportation you used on your recent trip to… Select all that apply.
Base: respondents that indicated they have visited these areas. Not all options were offered for each area. Moraine Lake was a single response question and was not select all that apply. This question was not asked for Paradise Valley.
Personal or rental vehicle
- Lake Louise area (n=743) 81%
- Upper Lake Louise (n=528) 85%
- Moraine Lake (n=391) 28%
Active modes
- Lake Louise area (n=743) 16%
- Upper Lake Louise (n=528) 14%
- Moraine Lake (n=391) 17%
Parks Canada shuttle
- Lake Louise area (n=743) 15%
- Upper Lake Louise (n=528) 14%
- Moraine Lake (n=391) 30%
Commercial private transport
- Lake Louise area (n=743) 7%
- Upper Lake Louise (n=528) 7%
- Moraine Lake (n=391) 11%
RV or camper van
- Lake Louise area (n=743) 3%
- Upper Lake Louise (n=528) 4%
- Moraine Lake (n=391) less than 1%
Taxi
- Lake Louise area (n=743) less than 1%
- Upper Lake Louise (n=528) less than 1%
- Moraine Lake (n=391) less than 1%
Prefer not to answer
- Lake Louise area (n=743) 6%
- Upper Lake Louise (n=528) less than 1%
- Moraine Lake (n=391) 12%
Back to top
What we heard
The strategies and actions presented were largely perceived as being effective. Respondents broadly support Parks Canada in taking the necessary actions to address the challenges in the area; however, they want to understand the reasoning behind these decisions. Support for protecting nature and wildlife was reiterated through these surveys and is consistent with earlier public engagement for this project (desired conditions) and the Banff National Park Management Plan.
- Visitation Volume: Many respondents supported reducing the number of visitors at key locations (e.g. visitor capacity) to help with crowding and congestion. Others felt congestion could be addressed by expanding parking lots, increasing services or growing infrastructure to accommodate ongoing increases in visitation.
- Access Considerations: Respondents care deeply about Lake Louise and have fond memories of the area. Many visit frequently, care about ecological integrity and want to continue to build memories long into the future. While they agree that visitor use is causing challenges and support actions to reduce congestion, they want the area to be easy to access.
- Preferential Access: Many respondents requested preferential access for locals. The definition of those who considered themselves ‘local’ varied by respondent but often included Bow Valley residents, Albertans and occasionally all Canadians. Forms of preferential access proposed included reservation blocks or dedicated parking for ‘locals’, or tiered pricing for non-local visitors.
- Price Strategies: While affordability remains a concern, respondents are supportive of using price strategies to manage visitation. Some felt that increasing entry fees would help manage visitation, especially during peak summer months, and that fees would be positively received if they supported the improvement of the site.
- Reservation Systems: There is general understanding about the benefits of reservations to provide predictable and certain access. Respondents would like tickets to be easier to obtain and require less advanced planning. Some feel that creating capacities or requiring reservations in more locations will make the reservation process more challenging and stressful. They also wanted assurances that Parks Canada could prevent bots, mass ticket purchase or ticket reselling. Many suggested changes such as random draws and rolling booking windows to help ensure equity.
Some of the suggestions received require a nationwide approach or are incompatible with the 2022 Banff National Park Management Plan or the Canada National Parks Act. These include expanding the developed footprint, increasing entry fees, preferential access, and surge or tiered pricing. These suggestions will be taken under advisement by Parks Canada but are outside the scope of the current Lake Louise Area VUM planning process.
Survey #1: General Strategies throughout the Lake Louise area
This survey explored four general strategies and their associated actions for the entire project area. The strategies were largely perceived as being effective, with strategy one (manage congestion and access) having the lowest perceived effectiveness at 56% and strategy three (protect wildlife and ecosystems) the highest at 71%.
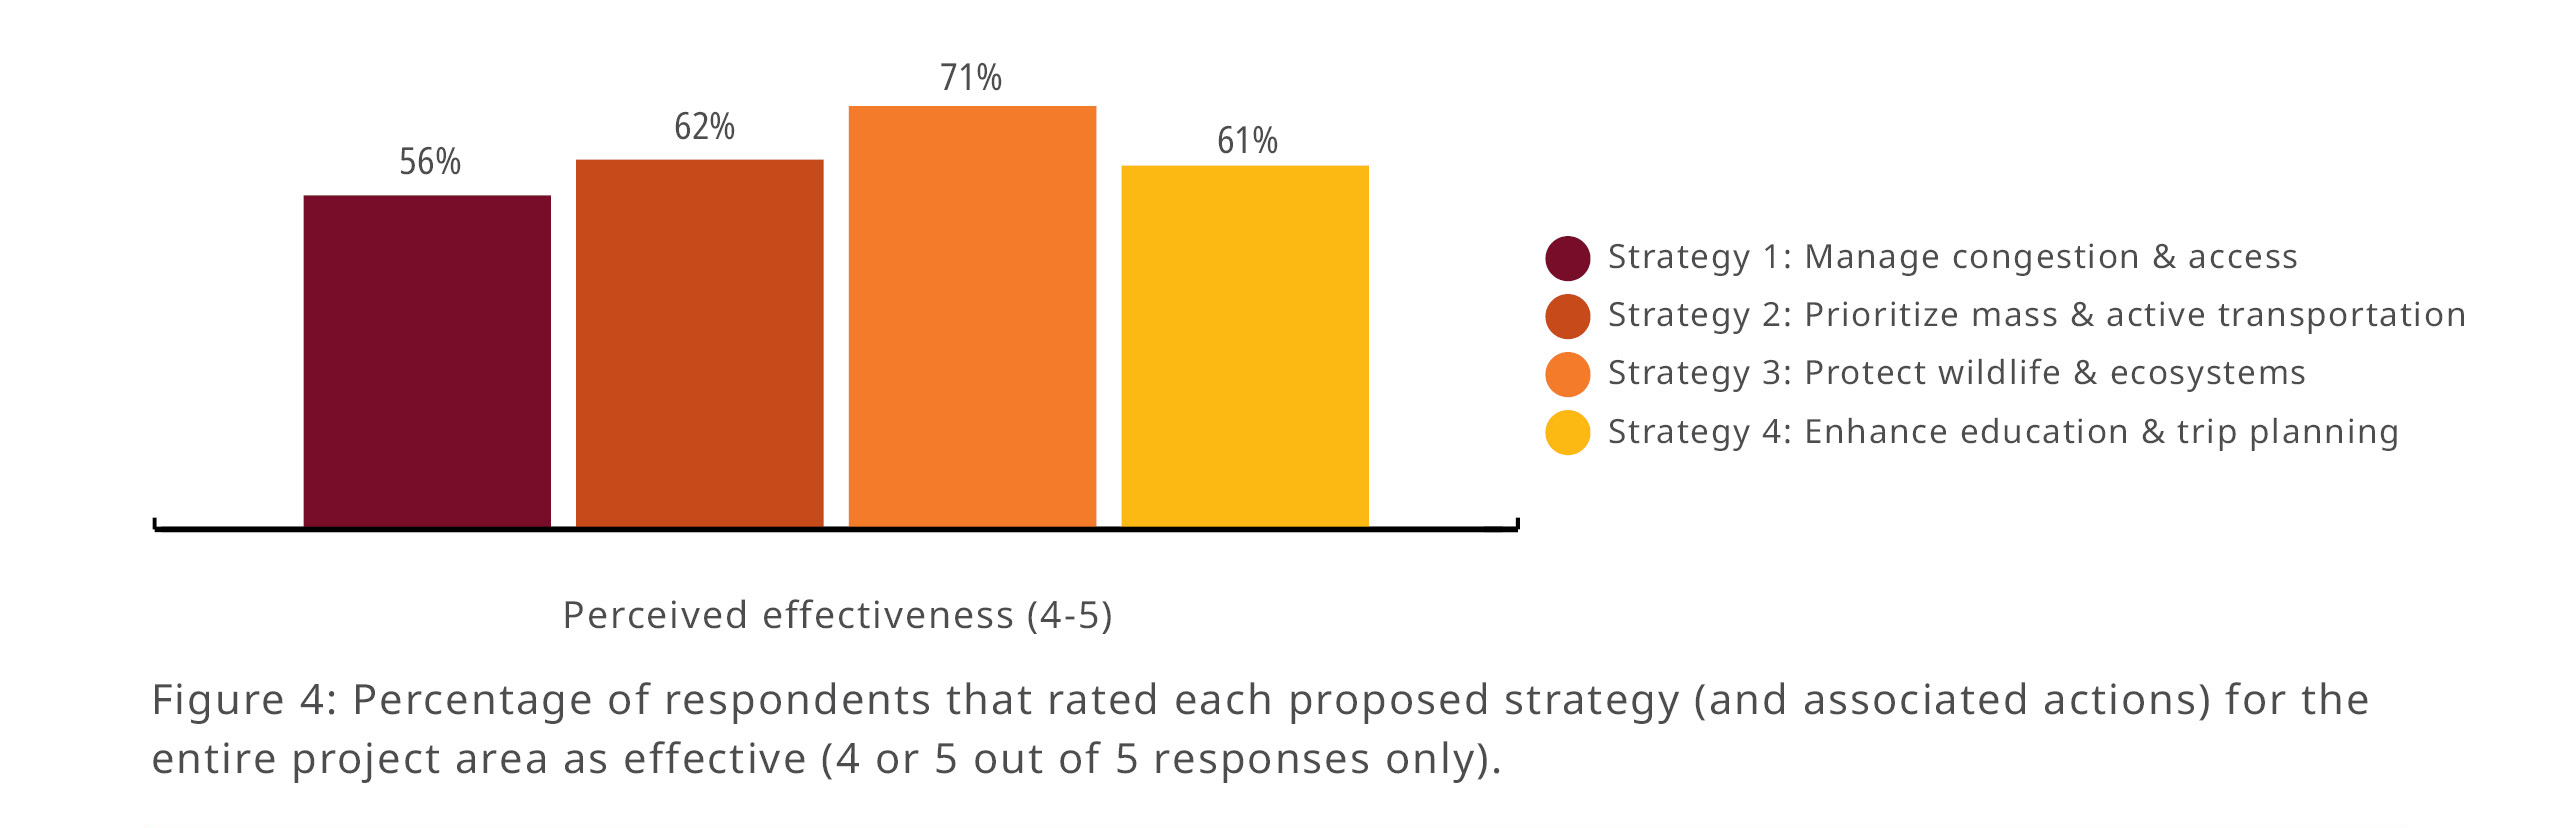
Figure 4: Percentage of respondents that rated each proposed strategy (and associated actions) for the entire project area as effective (4 or 5 out of 5 responses only).
- Strategy 1: Manage Congestion and Access 56%
- Strategy 2: Prioritize Mass and Active Transportation 62%
- Strategy 3: Protect Wildlife and Ecosystems 71%
- Strategy 4: Enhance education and Trip Planning 61%
Strategy 1: Manage Congestion and Access
The proposed actions to manage congestion and access had the lowest perceived effectiveness at 56% and received more feedback (n=525) than the other three strategies. Feedback was divided.
Some comments directly supported the proposed actions (7%) and timed-entry reservations specifically (10%). However, some found the actions too restrictive (5%) and argued that more people could be accommodated by increasing infrastructure, mass transit (5%), parking (8%) and active modes (4%). In contrast, others suggested reducing the number of visitors (20%), reducing the number of personal vehicles (11%) and reducing mass transit (4%). Some also suggested changes to pricing, such as tiered pricing (8%) or access fees instead of free entry (8%), would help reduce congestion.
When considering congestion management actions, participants frequently expressed concern that limiting access might impact their ability to visit. About a quarter of respondents called for access to be prioritized for ‘locals’ over other visitors.
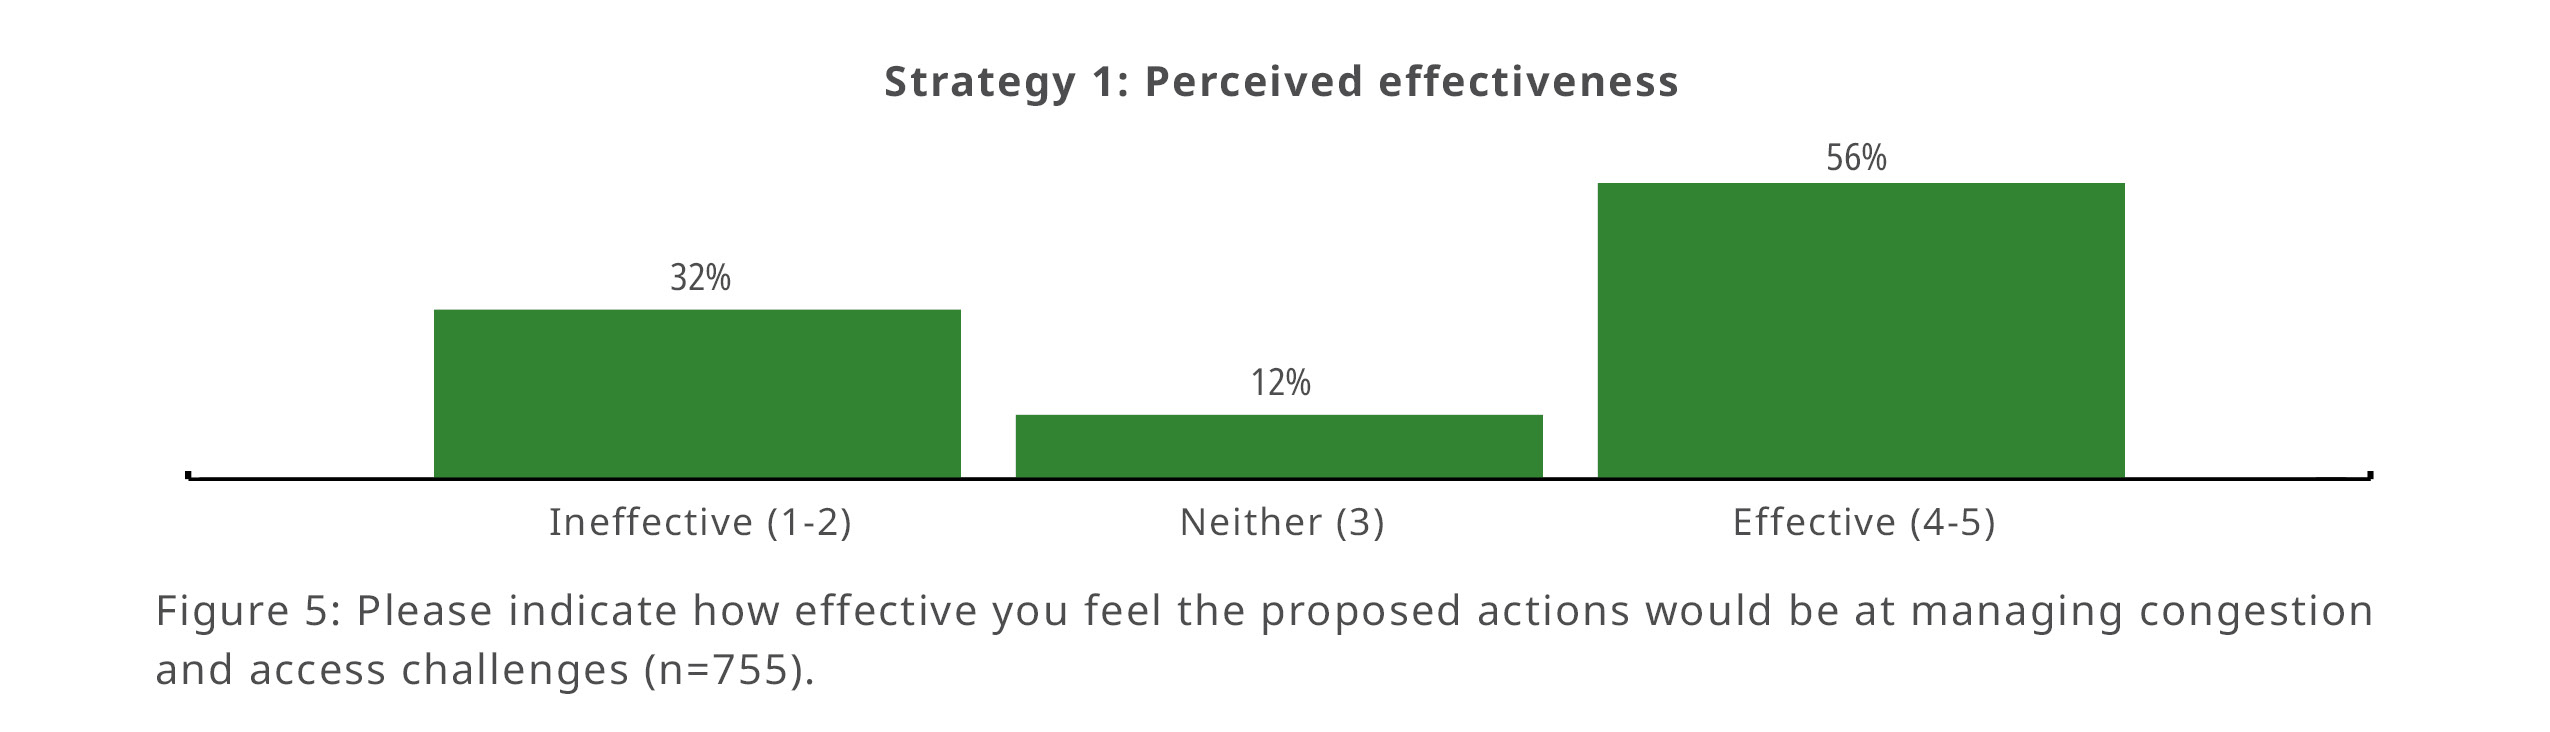
Figure 5: Please indicate how effective you feel the proposed actions would be at managing congestion and access challenges (n=755).
- Ineffective (1-2) 32%
- Neither (3) 12%
- Effective (4-5) 56%
Strategy 2: Prioritize Mass and Active Transportation
About 62% of respondents indicated prioritizing mass and active transportation would be a very or somewhat effective strategy. The following themes emerged from the comments provided (n=456).
Some respondents reiterated their support for this strategy as a whole (10%) or for specific actions including limiting personal vehicles (7%) and improving access and infrastructure for active transportation (7%). Respondents would like Parks Canada to consider improvements: increased transit options and shuttles (13%), more frequent trips in peak times (5%), extended hours (4%), better accessible shuttles (4%) or retaining parking spaces for visitors whose accessibility needs cannot be accommodated by shuttles (4%). Affordability of mass transportation options was also identified as important (13%).
Others were sceptical of mass transportation, citing overcrowding and expressed concern that transit might increase visitation. Some advocated for a daily limit (14%) while others felt that locals should be prioritized (10%) and that parking, lower fees or shuttle seats should be set aside for these specific users. Unsupportive respondents mentioned that shuttle tickets were currently too hard to secure or that the release dates did not allow for last minute flexibility. Some advocated for additional parking spaces and expanded lots (8%).
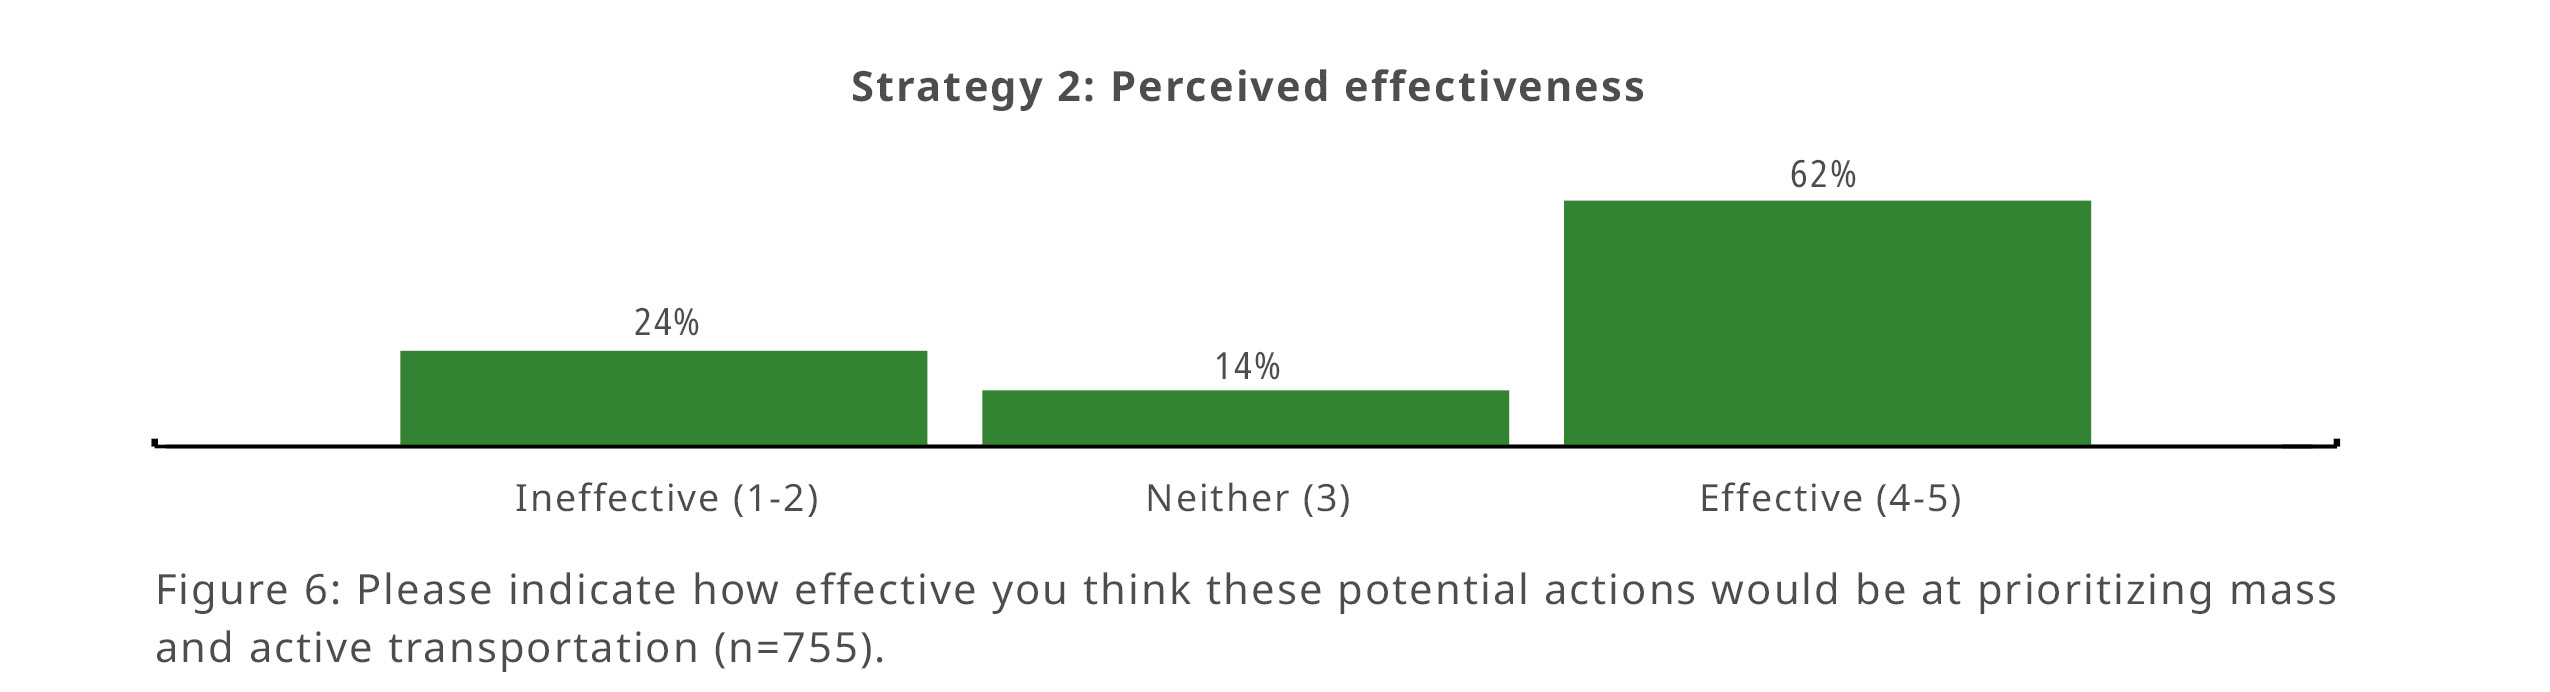
Figure 6: Please indicate how effective you think these potential actions would be at prioritizing mass and active transportation (n=755).
- Ineffective (1-2) 24%
- Neither (3) 14%
- Effective (4-5) 62%
Strategy 3: Protect Wildlife and Ecosystems
Actions to protect wildlife and ecosystems were perceived to be highly effective, receiving 71% support, similar to previous public engagements. When asked about the proposed actions or suggestions for other actions, the following themes emerged in the comments provided (n=359).
Some respondents reiterated support for the proposed actions (21%) including the use of seasonal or overnight road closures (6%) and trail closures (4%) to help protect wildlife and ecosystems. Others felt Parks Canada could do more to protect and manage wildlife (11%) and natural ecosystems (4%). Suggestions included limiting or reducing visitation to help manage crowding in the day as well as overnight/seasonally (16%).
Compliance and enforcement actions are mandated and therefore not assessed, but many respondents raised concerns about poor/disrespectful visitor behaviour such as ignoring park rules (5%) and littering (7%). Respondents called for increased enforcement and staff presence (16%), better visitor education (6%) and the use of fines or higher fines to address poor behaviour (6%).
Not all respondents were supportive of all the proposed actions to protect wildlife and ecosystems. Some disliked closing roads and trails (6%) and eliminating the Alpine Start shuttle (5%). Others felt that protecting the area was important as long as their own access was not restricted, perhaps not seeing themselves as contributing to impacts.
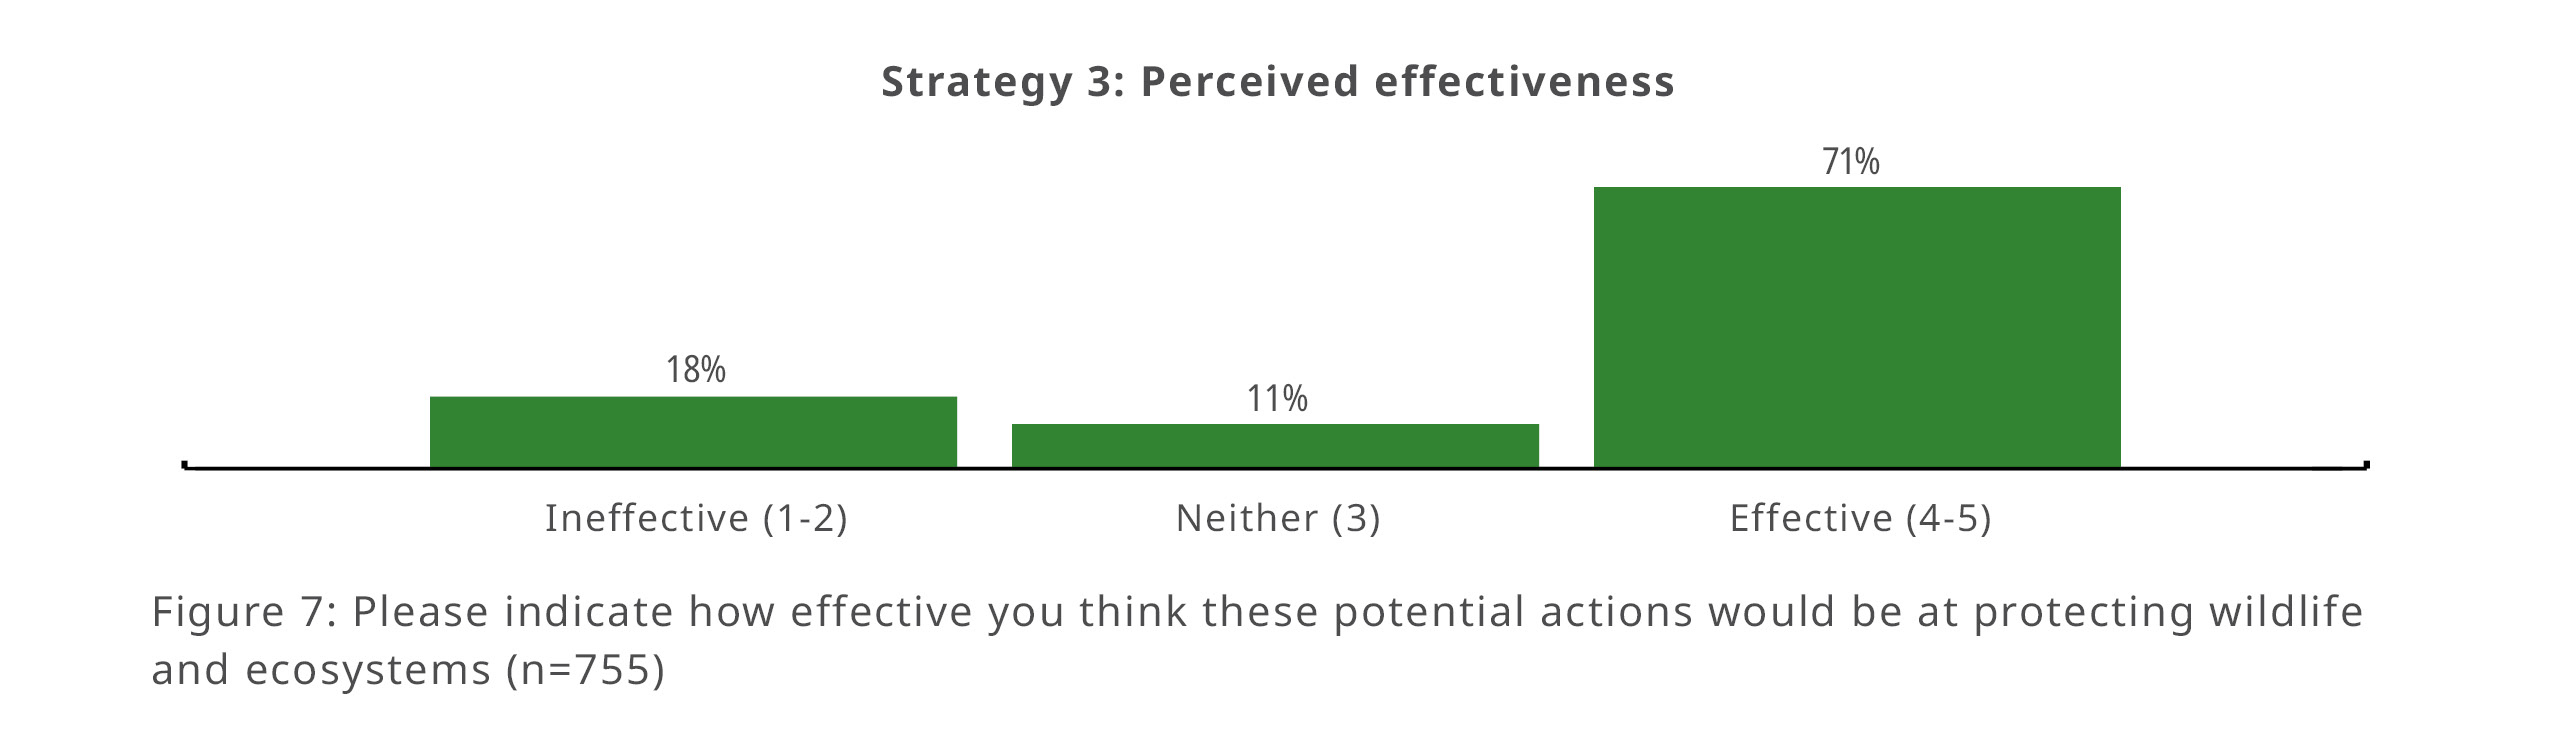
Figure 7: Please indicate how effective you think these potential actions would be at protecting wildlife and ecosystems (n=755).
- Ineffective (1-2) 18%
- Neither (3) 11%
- Effective (4-5) 71%
Strategy 4: Enhance Education and Trip Planning
Respondents considered the proposed actions to enhance education and trip planning to be fairly effective with 61% supporting them. The following themes emerged from the comments provided (n=364).
Respondents voiced support for improved public education (9%) focussed on trip planning tools (10%) and park rules and regulations (6%). Suggestions included signage (11%) in the Lake Louise area or closer to Calgary, improvements to the Parks Canada website (4%) and reservation system (4%), requiring visitors to complete courses about appropriate behaviour and regulations (4%), and increasing the presence of Indigenous voices (9%).
Improving Wi-Fi and cellular connection was more controversial. Some wanted to see more connectivity for emergencies and to help communicate real-time information (i.e. next shuttle arrival time, parking availability). Others argued that backcountry locations and day-use areas (including the lakeshores) are places to disconnect.
Some participants were so concerned by current visitor behaviour (4%) they believed education was not enough and proposed increasing enforcement (5%), reducing overall visitor volumes (10%), prioritizing local users, and charging higher entry fees to create a sense of pride in visitors and improve behaviour (4%).
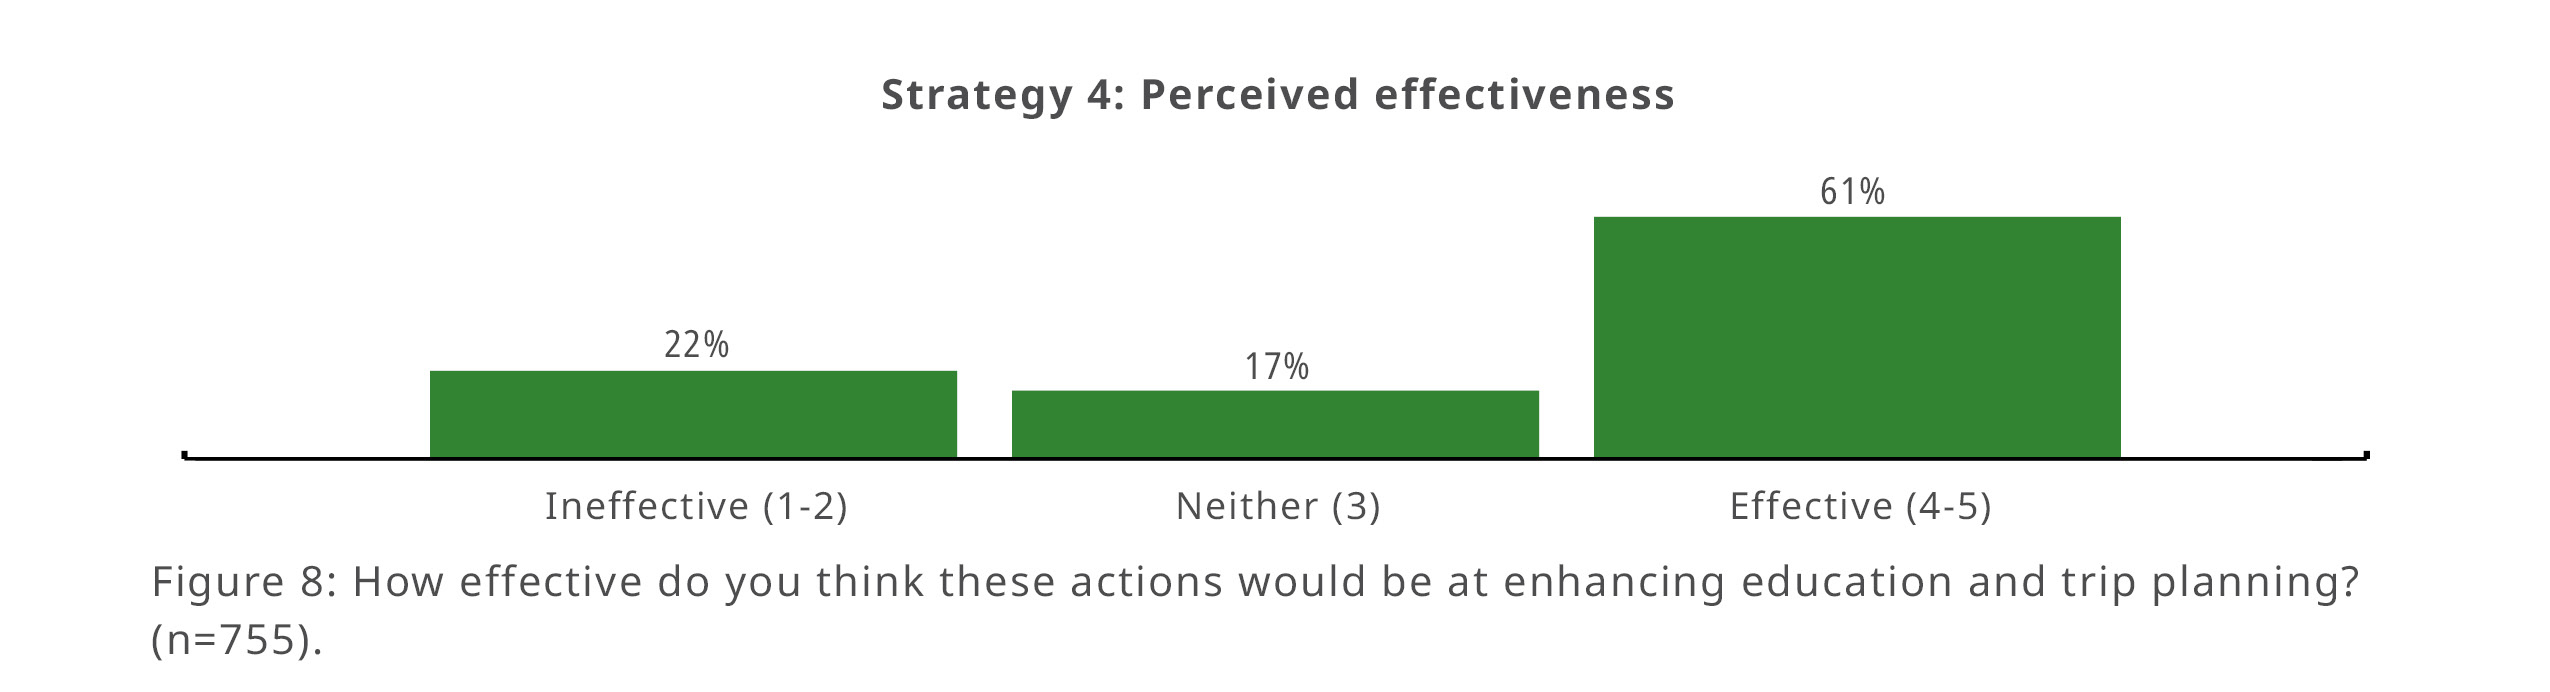
Figure 8: How effective do you think these actions would be at enhancing education and trip planning? (n=755).
- Ineffective (1-2) 22%
- Neither (3) 17%
- Effective (4-5) 61%
Survey #2: Upper Lake Louise
This survey explored what visitors consider important when visiting Upper Lake Louise and which transportation modes visitors would be most likely to use. It also explored the perceived effectiveness of reducing vehicle congestion/improving visitor experience, and the level of support of four potential scenarios to address personal vehicle access at Upper Lake Louise.
Respondent priorities
When asked to rate the importance of various factors at Upper Lake Louise, protecting the environment was rated highest (88%). Reducing vehicle congestion and crowding (76%), safety (74%) and ease of access (71%) were close behind. Affordability received the lowest “high importance” rating (58%). This may indicate that some respondents were willing to sacrifice affordability to ensure environmental protection and reduced congestion.
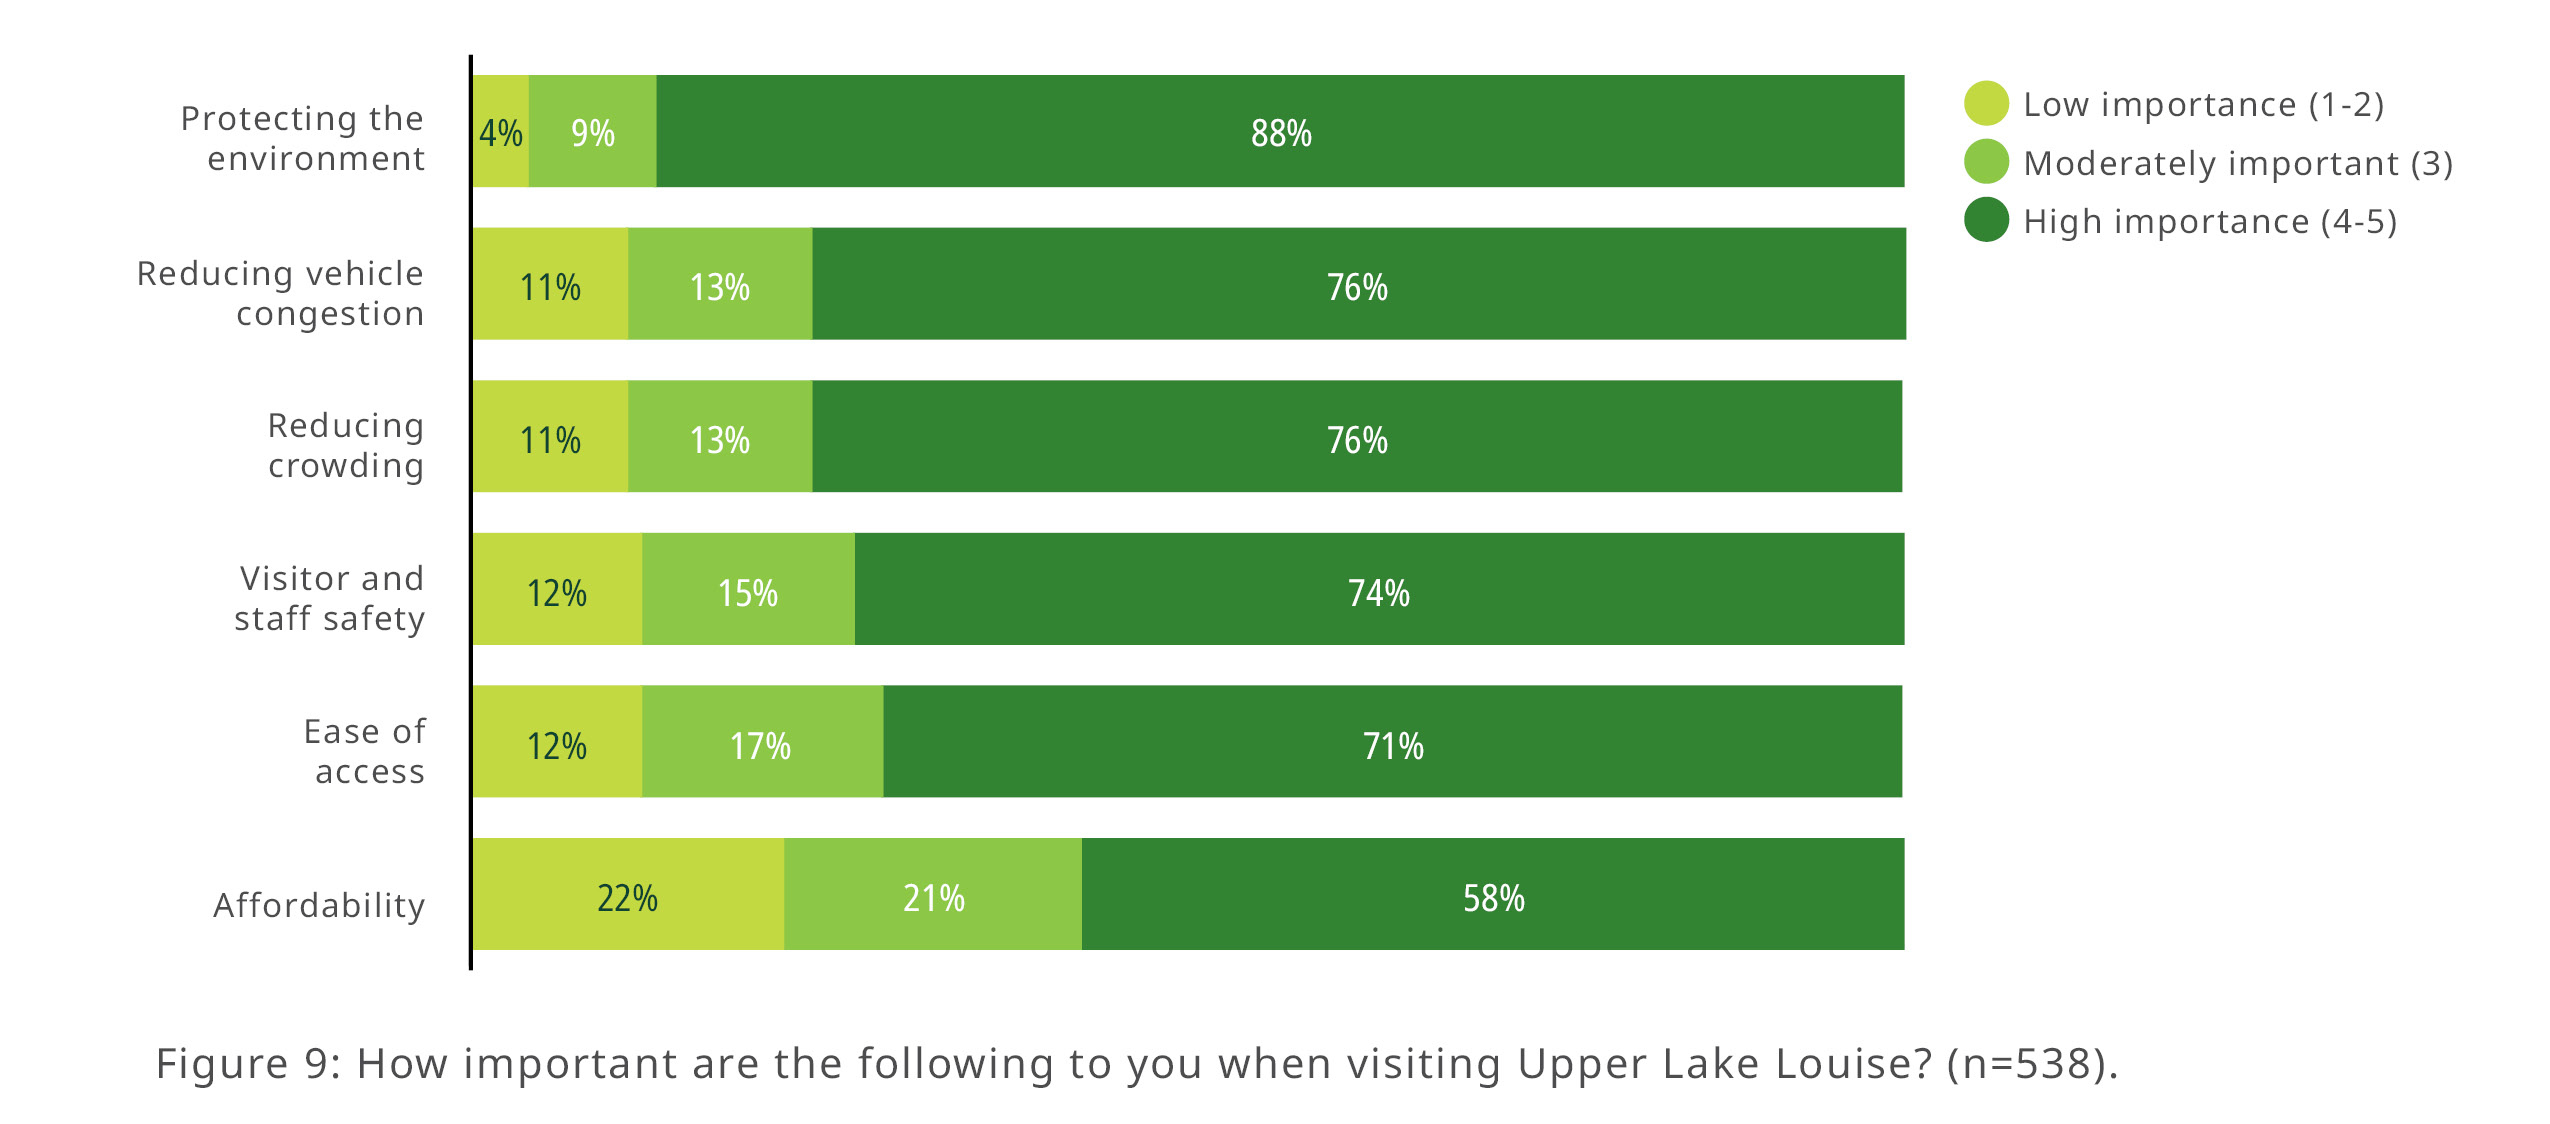
Figure 9: How important are the following to you when visiting Upper Lake Louise? (n=538).
Protecting the environment
- Low importance (1-2) 4%
- Moderately important (3) 9%
- High importance (4-5) 88%
Reducing vehicle congestion
- Low importance (1-2) 11%
- Moderately important (3) 13%
- High importance (4-5) 76%
Reducing crowding
- Low importance (1-2) 11%
- Moderately important (3) 13%
- High importance (4-5) 76%
Visitor and staff safety
- Low importance (1-2)12%
- Moderately important (3) 15%
- High importance (4-5) 74%
Ease of access
- Low importance (1-2) 12%
- Moderately important (3) 17%
- High importance (4-5) 71%
Affordability
- Low importance (1-2) 22%
- Moderately important (3) 21%
- High importance (4-5) 58%
Proposed Scenarios
The remaining questions assess the perceived effectiveness of level of support for, and willingness to use four potential ways to access Upper Lake Louise.
- Scenario A: First-come, first- served paid parking
- Scenario B: Parking reservations with no entry restrictions
- Scenario C: Parking reservations with timed-entry and fixed length of stay
- Scenario D: Personal vehicles restricted. Access by shuttle, transit or active modes.
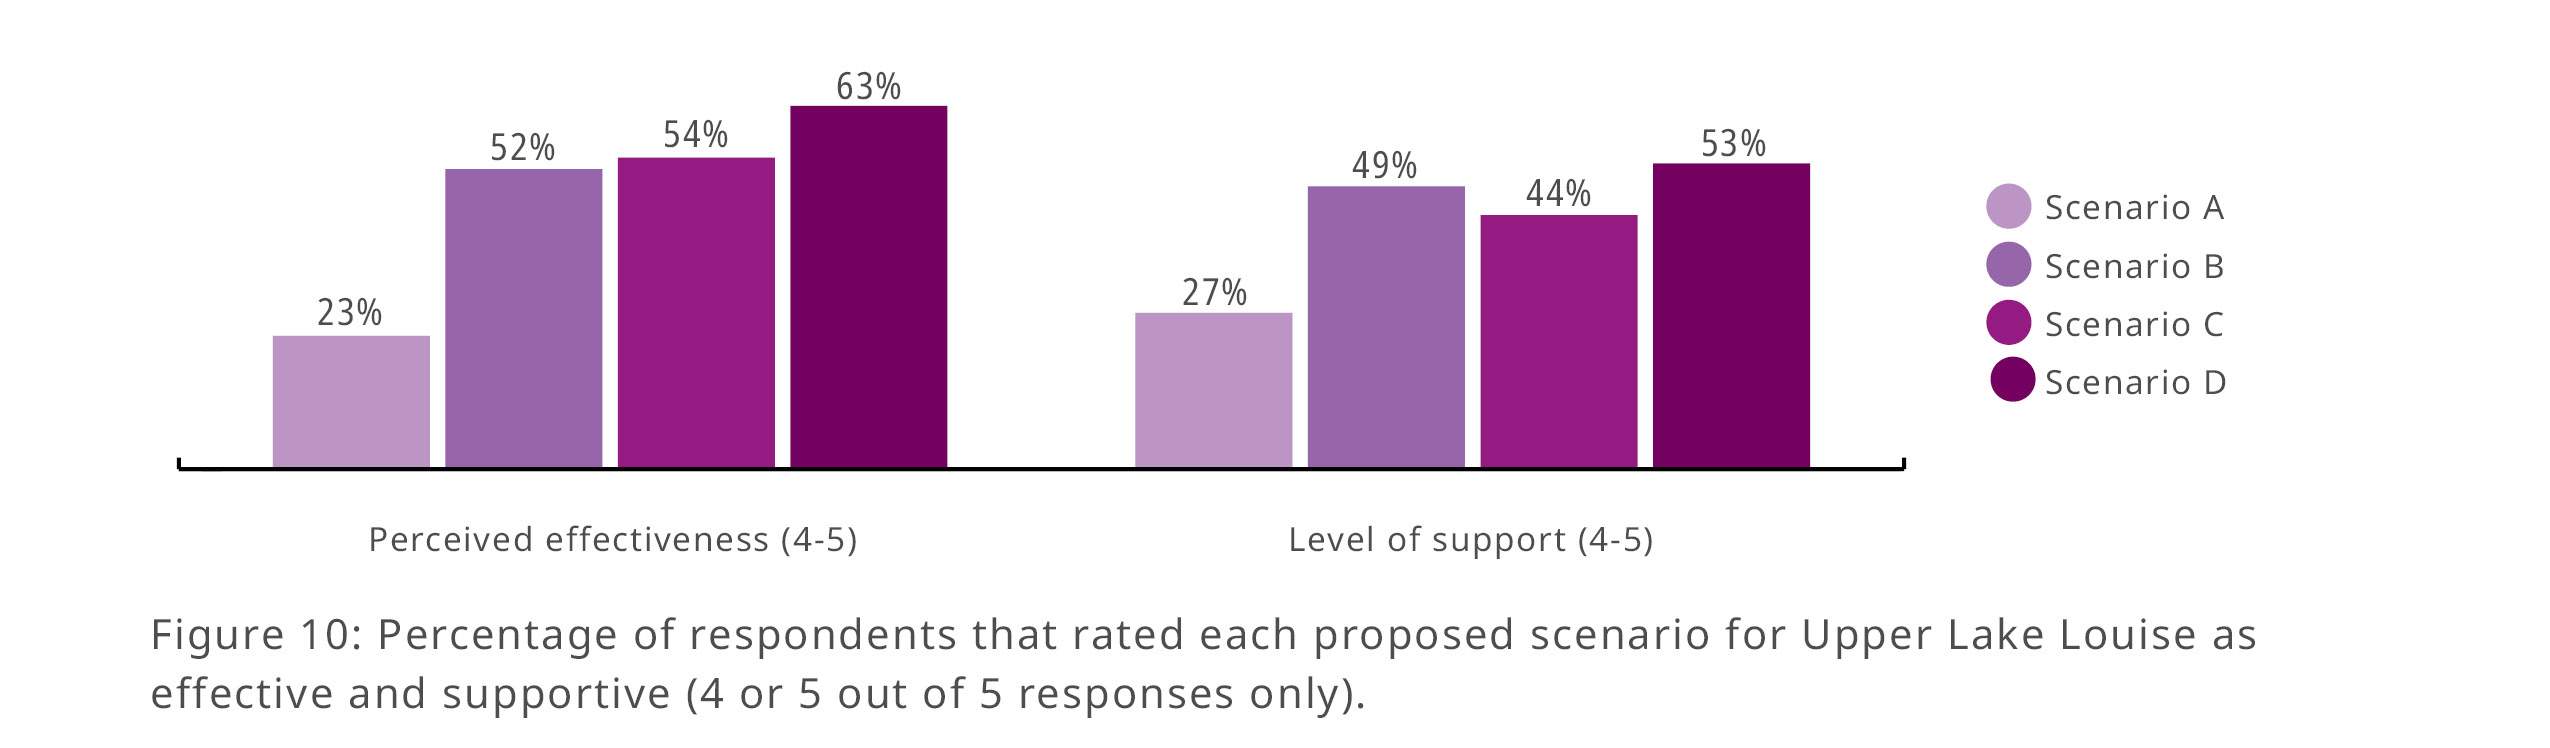
Figure 10: Percentage of respondents that rated each proposed scenario for Upper Lake Louise as effective and supportive (4 or 5 out of 5 responses only).
Perceived effectiveness
- Scenario A: First-come, first-served paid parking 23%
- Scenario B: Parking reservations with no entry restrictions 52%
- Scenario C: Parking reservations with timed-entry and fixed length of stay 54%
- Scenario D: Personal vehicles restricted. Access by shuttle, transit or active modes. 63%
Level of support
- Scenario A: First-come, first-served paid parking 27%
- Scenario B: Parking reservations with no entry restrictions 49%
- Scenario C: Parking reservations with timed-entry and fixed length of stay 44%
- Scenario D: Personal vehicles restricted. Access by shuttle, transit or active modes. 53%
Scenario A: First-come, first-served paid parking
Out of the four scenarios proposed, this one received the least support. Only 27% of respondents supported this option while 66% perceived it as least effective. Calgary area residents were noticeably less likely to oppose this scenario (50% opposed) than respondents from the Bow Valley or elsewhere in Alberta (70% opposed).
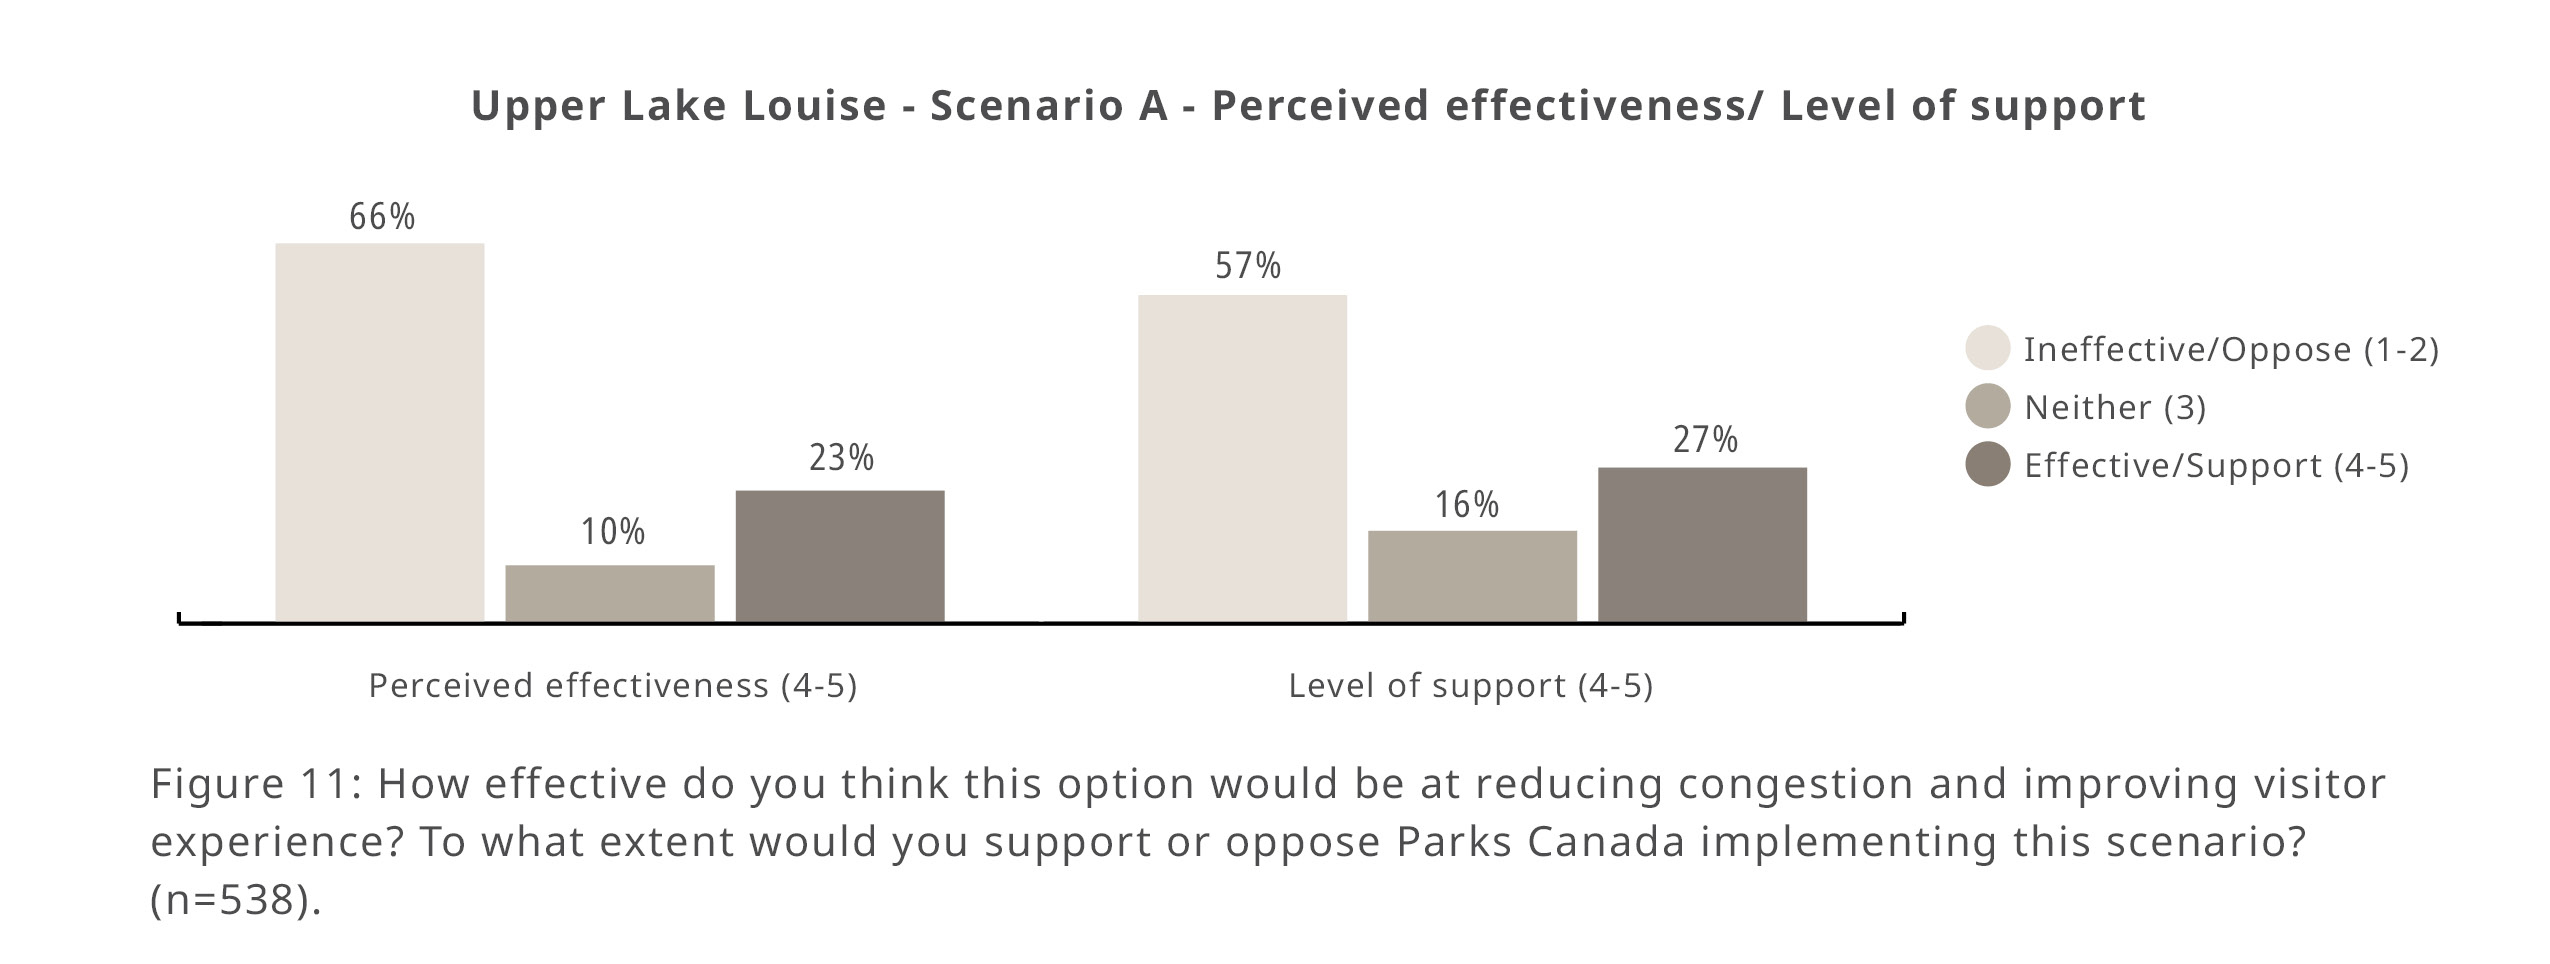
Figure 11: How effective do you think this option would be at reducing congestion and improving visitor experience? To what extent would you support or oppose Parks Canada implementing this scenario? (n=538).
Scenario A: First-come, first-served paid parking
Perceived effectiveness
- Ineffective (1-2) 66%
- Neither (3) 52 10%
- Effective (4-5) 23%
Level of support
- Oppose (1-2) 57%
- Neither (3) 16%
- Supportive (4-5) 27%
When asked to provide additional comments on the proposed scenario, many respondents (n=312) felt it would be ineffective (17%). They expressed concern that it was too much like current conditions and would lead to increasing congestion (23%) and more people being turned away due to full parking lots (10%). They felt that a reduction in visitors (13%) and personal vehicles (5%) was needed.
A minority felt the current system works fine (4%) and felt congestion could be mitigated by building more parking stalls, providing more mass transit options (4%) and increasing fees (6%).
As in Survey 1, some expressed concern that locals are finding it harder to visit this area and called for more access for this user group (14%).
Scenario B: Parking reservations with no entry restrictions
About half of respondents (n=538) said they would likely use parking reservations (55%), felt reservations would be effective (52%), and would support Parks Canada adopting this approach (49%). Regional visitors were more likely to consider this an effective option (Calgary 55% and Alberta 62%) and least likely to oppose it (Calgary 38%, Alberta 34%, elsewhere in Canada 28%). Bow Valley residents were less likely to consider it effective (44%) and more likely to oppose the implementation of this scenario (51%).
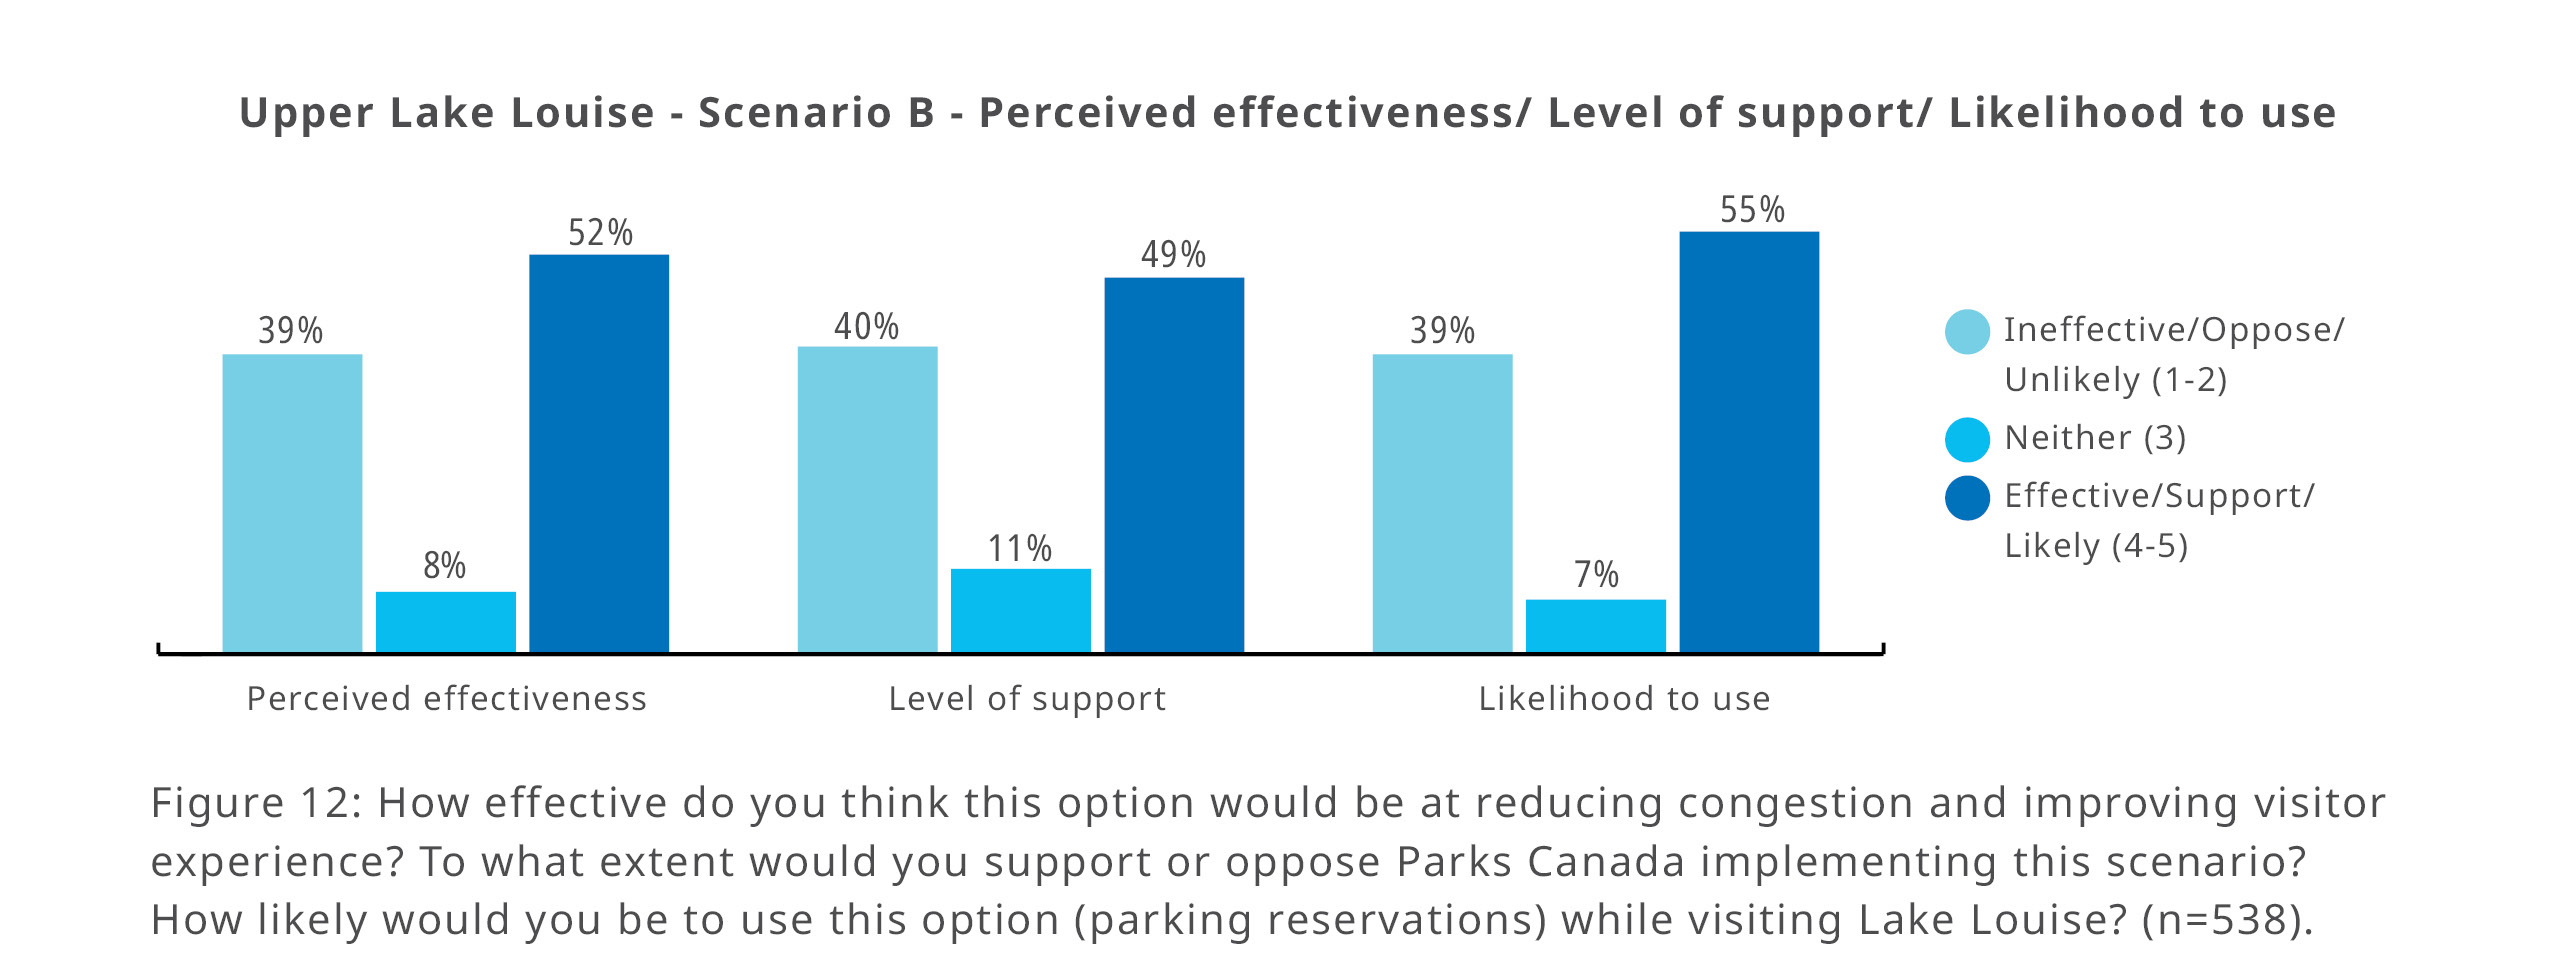
Figure 12: How effective do you think this option would be at reducing congestion and improving visitor experience?
To what extent would you support or oppose Parks Canada implementing this scenario?
How likely would you be to use this option (parking reservations) while visiting Lake Louise?
(n=538).
Scenario B: Parking reservations with no entry restrictions
Perceived effectiveness
- Ineffective (1-2) 39%
- Neither (3) 52 8%
- Effective (4-5) 52%
Level of support
- Oppose (1-2) 40%
- Neither (3) 11%
- Supportive (4-5) 49%
Likelihood to use
- Unlikely (1-2) 39%
- Neither (3) 7%
- Likely (4-5) 55%
Many respondents provided comments (n=306). Those who were supportive (13%) liked the certainty of a reservation and the flexibility of no time limits (4%). Concerns were raised about enforcement (6%), high demand (14%), empty or underused spaces due to variable length of stays (7%), unaffordable fees (4%), misuse of the system or reselling of reservations, access management for visitors without reservations (6%), and shifting traffic problems to nearby locations.
Some respondents felt locals (16%) and Canadians (6%) should have priority access over visitors from elsewhere, often prioritizing flexibility.
Scenario C: Parking reservations with timed-entry and fixed length of stay
Like Scenario B, responses were nearly split for this scenario. Nearly half of respondents (n=538) indicated they were likely to use this option (46%) and believed it would be effective (54%). Despite this, less than half (44%) of respondents said they would support Parks Canada implementing this scenario.
In contrast to Scenario B, there were no notable differences between respondent subgroups pertaining to perceived effectiveness or level of support towards this scenario.
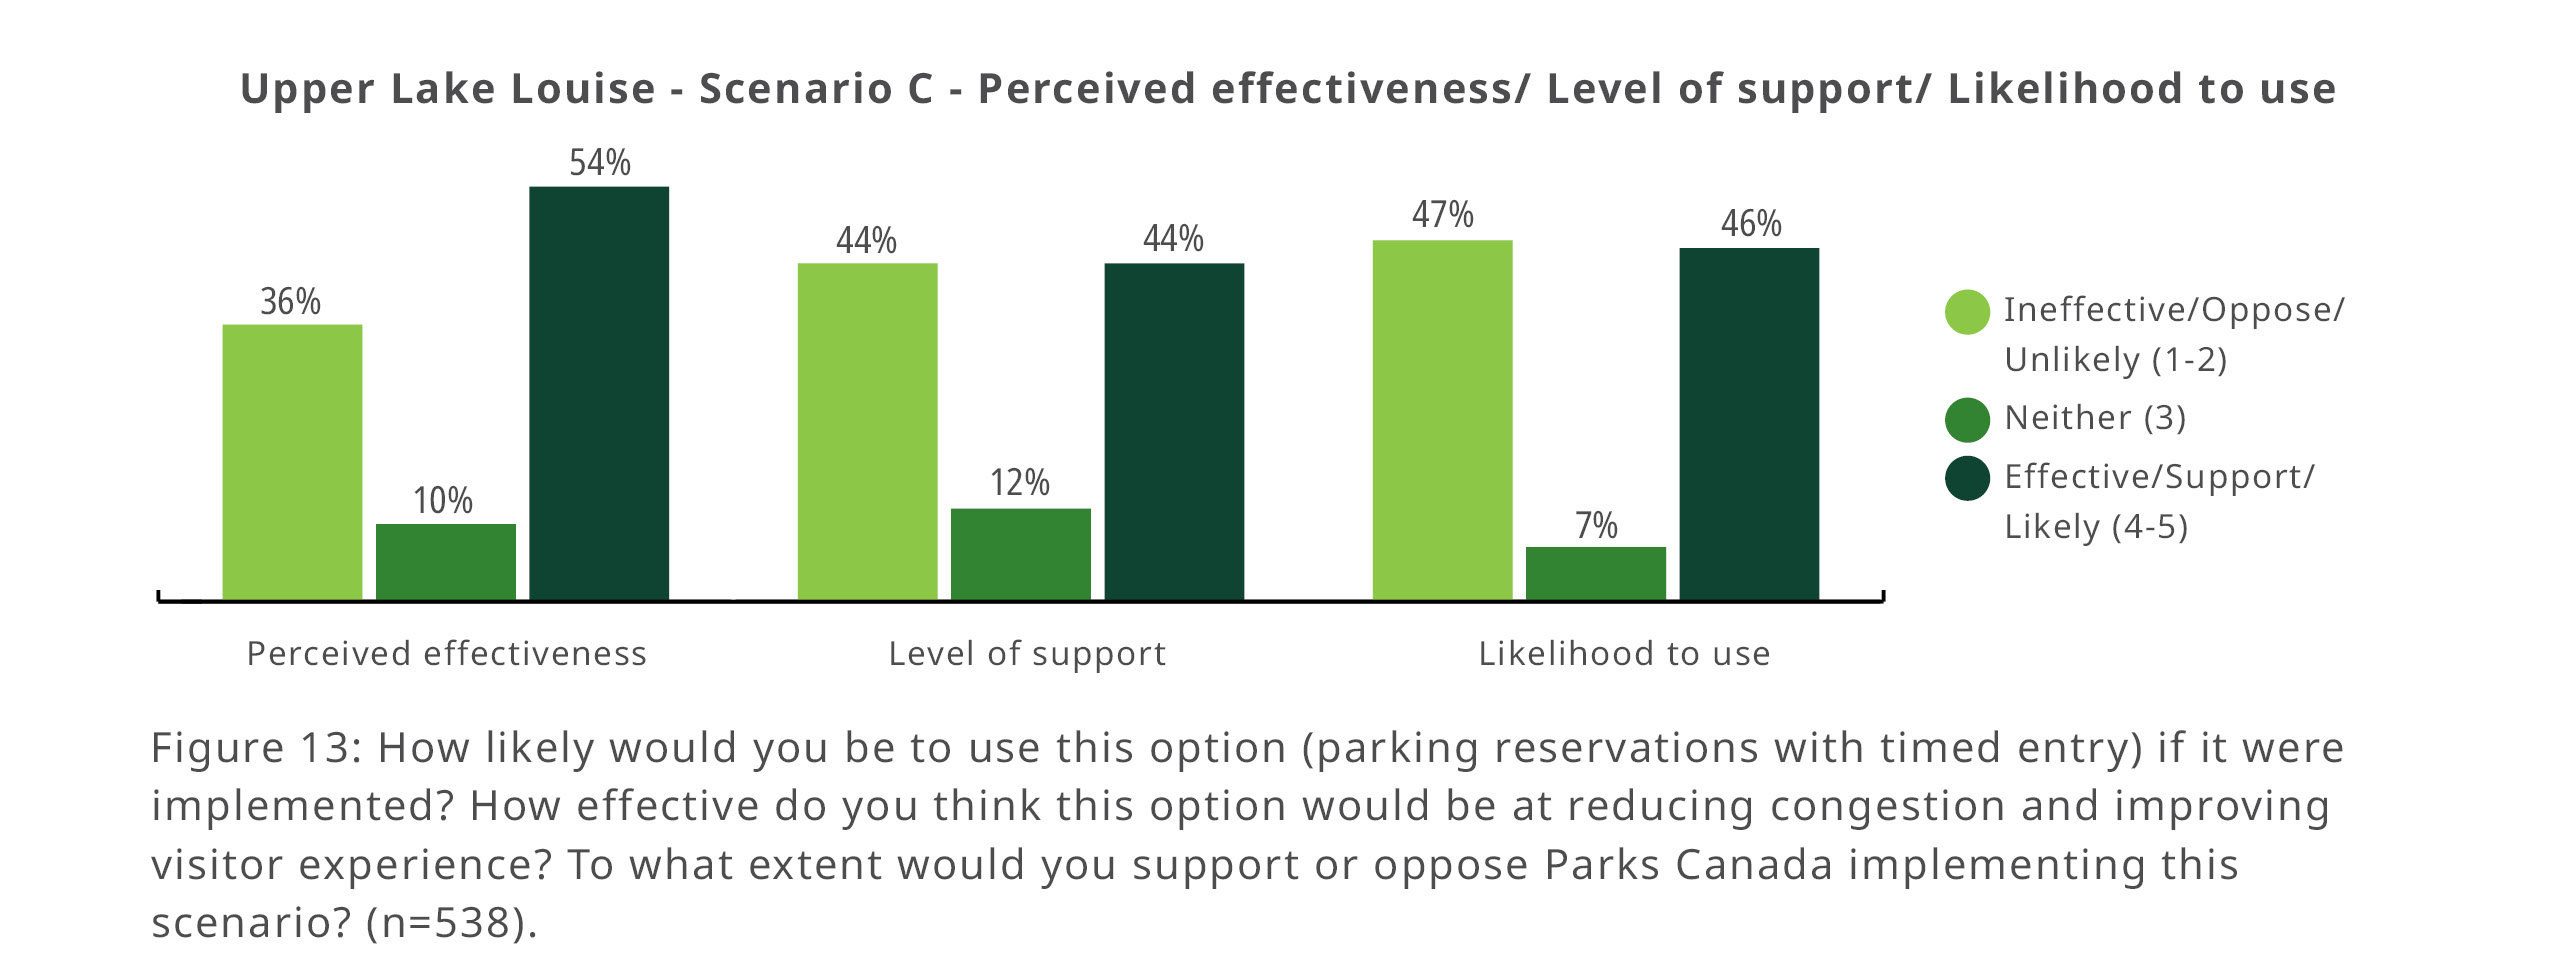
Figure 13: How likely would you be to use this option (parking reservations with timed entry) if it were implemented? How effective do you think this option would be at reducing congestion and improving visitor experience? To what extent would you support or oppose Parks Canada implementing this scenario? (n=538).
Scenario C: Parking reservations with timed-entry and fixed length of stay
Perceived effectiveness
- Ineffective (1-2) 36%
- Neither (3) 52 10%
- Effective (4-5) 54%
Level of support
- Oppose (1-2) 44%
- Neither (3) 12%
- Supportive (4-5) 44%
Likelihood to use
- Unlikely (1-2) 47%
- Neither (3) 7%
- Likely (4-5) 46%
Of those who provided additional comments (n = 330), many said this option would not work well for visitors wanting a full day experience (37%) despite shuttles still being an option. Others raised concerns about overstays (5%), the need increased enforcement (15%) and penalties, and challenges with execution.
Suggestions for improvement included different length of stay options (10%) and giving priority access for certain user groups, such as locals (8%).
Scenario D: Personal vehicle restricted - access by shuttle, transit, or active modes
Respondents felt this scenario was the most likely to achieve the desired conditions and rated it as effective (63%). Additionally, just over half of respondents said they were likely to use this option (53%) and would support Parks Canada implementing it (53%). While this option had the highest perceived effectiveness and one of the highest levels of support across the four scenarios, it was also the most polarizing. While 33% chose it as their preferred option, a similar number (32%) chose it as their least preferred option.
Bow Valley residents were more likely to perceive this option as effective (72%) than residents from the Calgary area (54%). This same trend was seen in support levels, with 64% of Bow Valley respondents supporting implementation compared to 41% of respondents from Calgary.
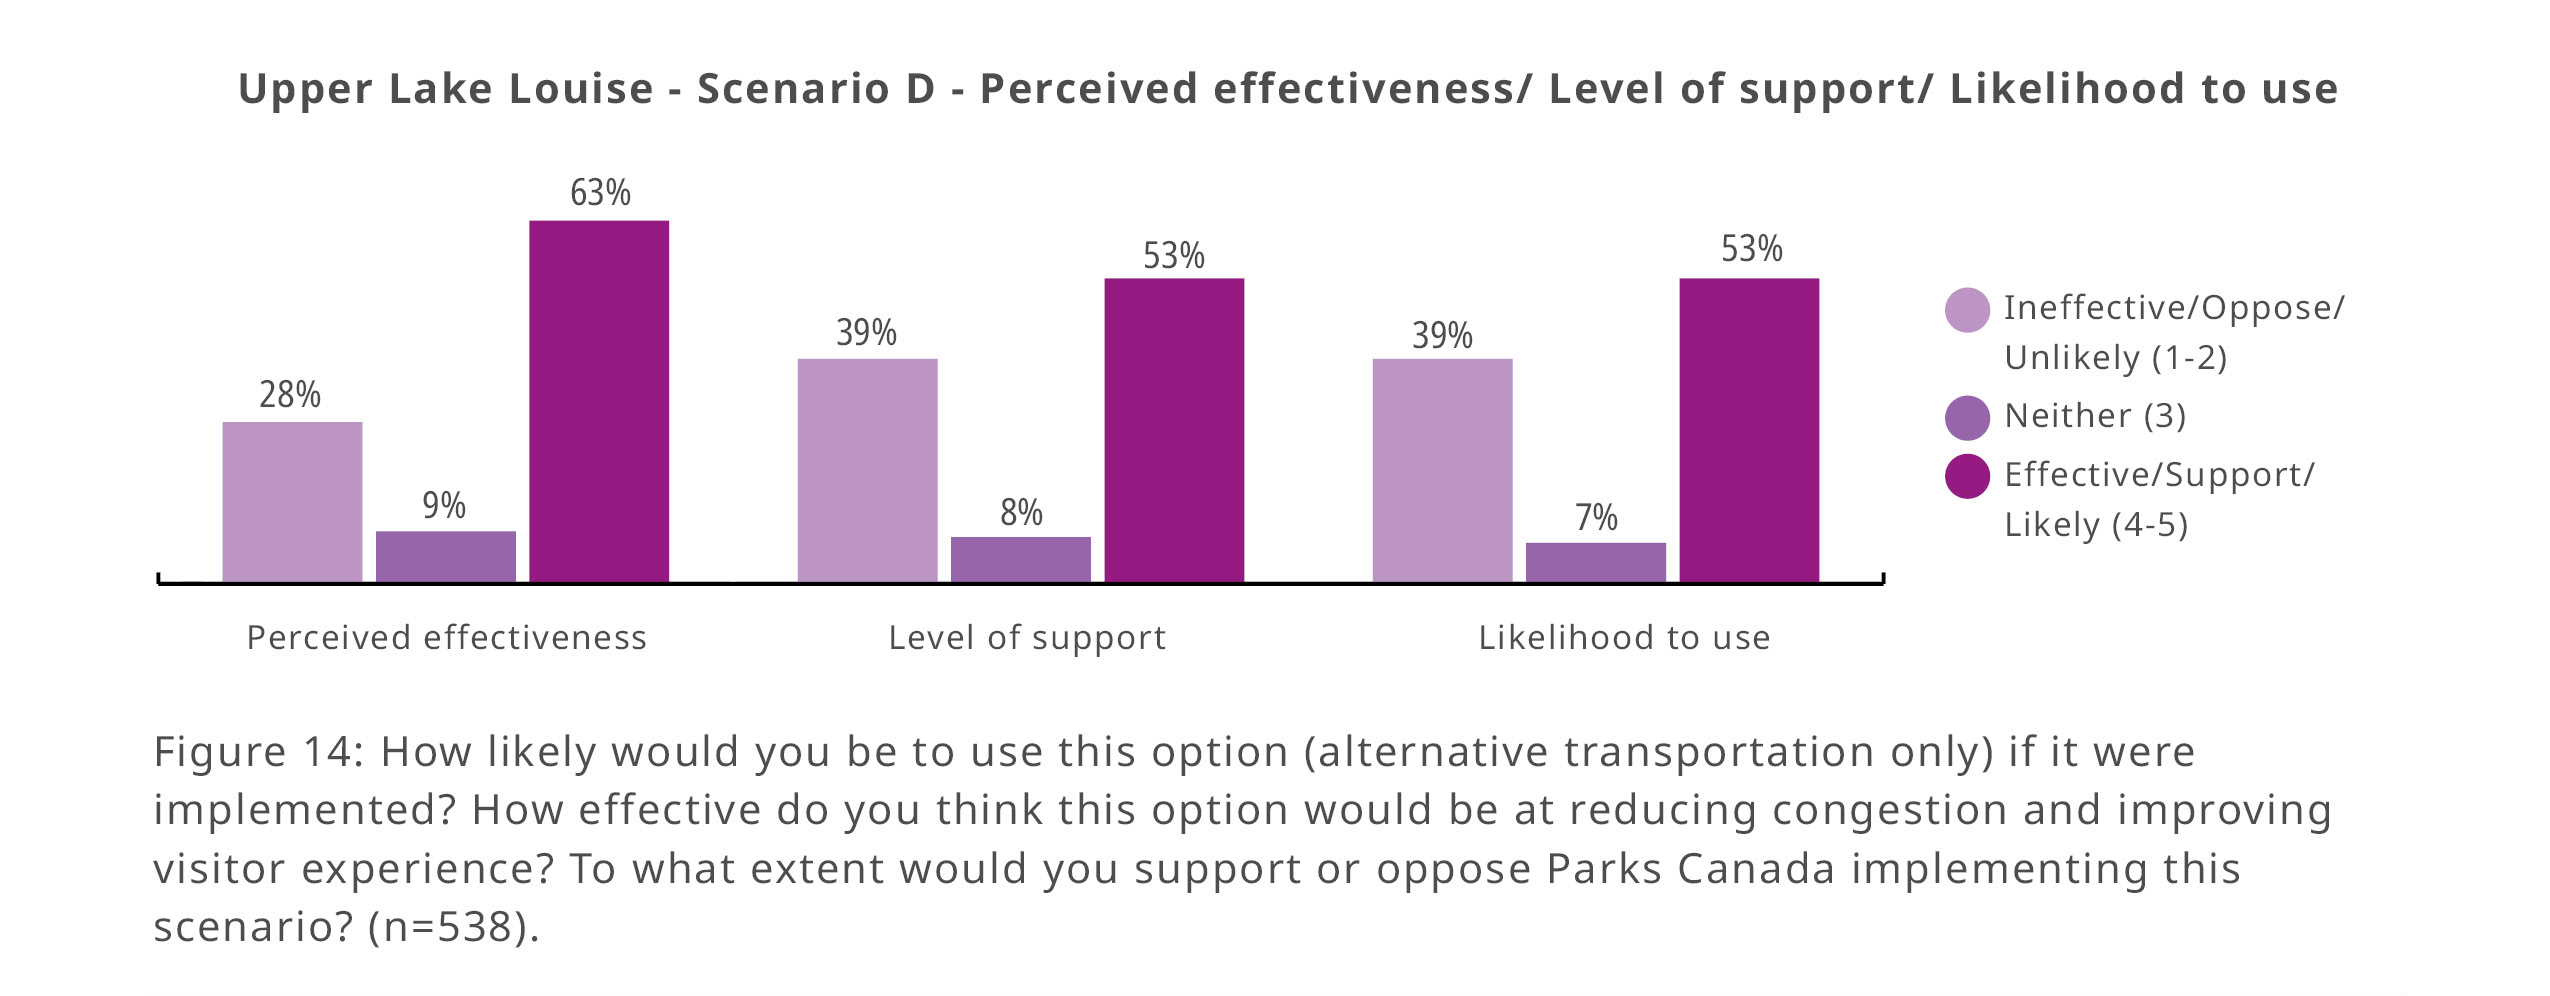
Figure 14: How likely would you be to use this option (alternative transportation only) if it were implemented? How effective do you think this option would be at reducing congestion and improving visitor experience? To what extent would you support or oppose Parks Canada implementing this scenario? (n=538).
Scenario D: Personal vehicle restricted – access by shuttle, transit, or active modes
Perceived effectiveness
- Ineffective (1-2) 28%
- Neither (3) 52 9%
- Effective (4-5) 63%
Level of support
- Oppose (1-2) 39%
- Neither (3) 8%
- Supportive (4-5) 53%
Likelihood to use
- Unlikely (1-2) 39%
- Neither (3) 7%
- Likely (4-5) 53%
Of those who provided comments (n=351) many saw this option as effective at reducing congestion (12%) and protecting nature and wildlife. Others saw this option as too restrictive (6%) and called for expanded infrastructure to accommodate more personal vehicles (8%).
Suggestions included expanding transit and shuttle options (10%), increasing frequency (6%) and operating hours (5%), keeping fares affordable (11%), ensuring accessibility for people with disabilities or mobility challenges (4%), accommodating a wide variety of recreational gear (backpacks, watercraft and bikes) (5%), and pets, supporting longer stays, and improving infrastructure and facilities (5%).
Others preferred reduced overall daily visitation (13%) and fewer commercial operators (5%). Many were concerned this scenario would make Parks Canada shuttle reservations even harder to obtain. As with other scenarios, respondents requested improved access for locals (16%) and Canadians (5%).
Summary of Upper Lake Louise Parking Scenario preferences
Scenario A – This scenario was often seen as an undesirable outcome as it closely mirrored the current conditions. It was the least preferred scenario for nearly half of respondents (47%). Respondents from the Calgary area preferred this option most often (27%).
Scenarios B and C – Both scenarios were seen as reasonable options, with B performing slightly better. Respondents indicated that key details, such as length of stay, visitor compliance and enforcement, would need to be clearly defined before implementation. These options were not only ranked highly as top choices but were least likely to be ranked last. While many respondents liked the option to drive a personal vehicle, they acknowledged that this system would be the hardest for Parks Canada to implement.
Scenario D – While seen as the most effective option, Scenario D was also the most polarizing. It was the most preferred option for 33% of respondents and the least preferred option by 32%. Bow Valley residents (46%) and Canadians from outside Alberta (39%) were the most likely to select Scenario D as their preferred option. In contrast, nearly half (41%) of Calgary respondents ranked it as their least preferred option, compared to only 23% of Bow Valley respondents.
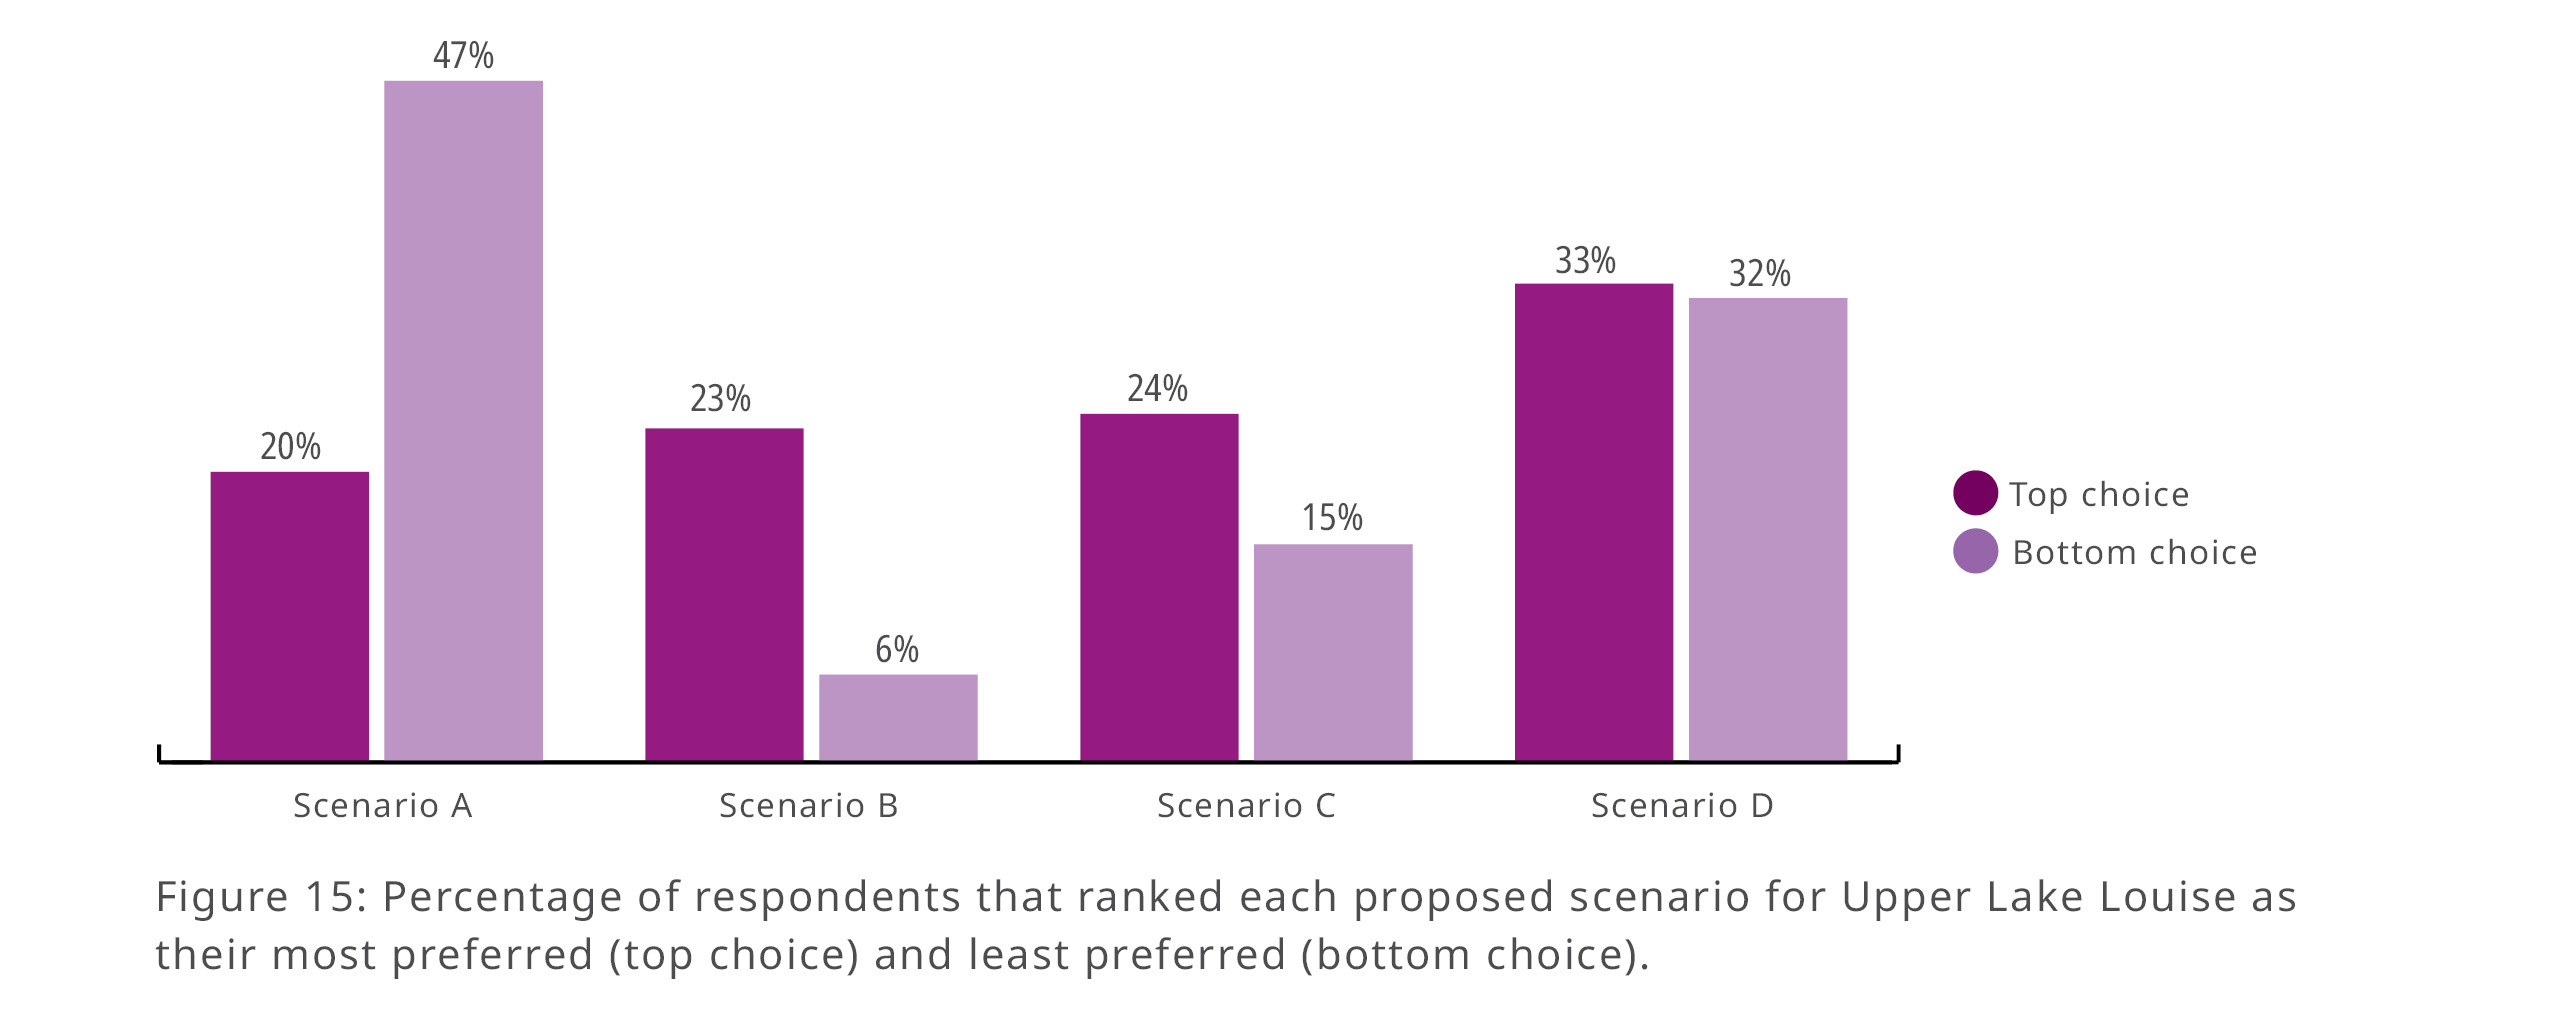
Figure 15: Percentage of respondents that ranked each proposed scenario for Upper Lake Louise as their most preferred (top choice) and least preferred (bottom choice).
Top choice
- Scenario A: First-come, first-served paid parking 20%
- Scenario B: Parking reservations with no entry restrictions 23%
- Scenario C: Parking reservations with timed-entry and fixed length of stay 24%
- Scenario D: Personal vehicles restricted. Access by shuttle, transit or active modes. 33%
Bottom choice
- Scenario A: First-come, first-served paid parking 47%
- Scenario B: Parking reservations with no entry restrictions 6%
- Scenario C: Parking reservations with timed-entry and fixed length of stay 15%
- Scenario D: Personal vehicles restricted. Access by shuttle, transit or active modes. 32%
Survey #3: Moraine Lake and Paradise Valley
The purpose of this survey was to measure the perceived effectiveness or level of support for potential actions at Moraine Lake and at Paradise Valley.
Moraine Lake
Respondents were asked whether the strategies and actions presented would improve the visitor experience and help better protect the environment. Of the respondents (n=404), over half (53%) felt that the actions would improve the visitor experience while slightly less than half (42%) thought they would help protect wildlife.
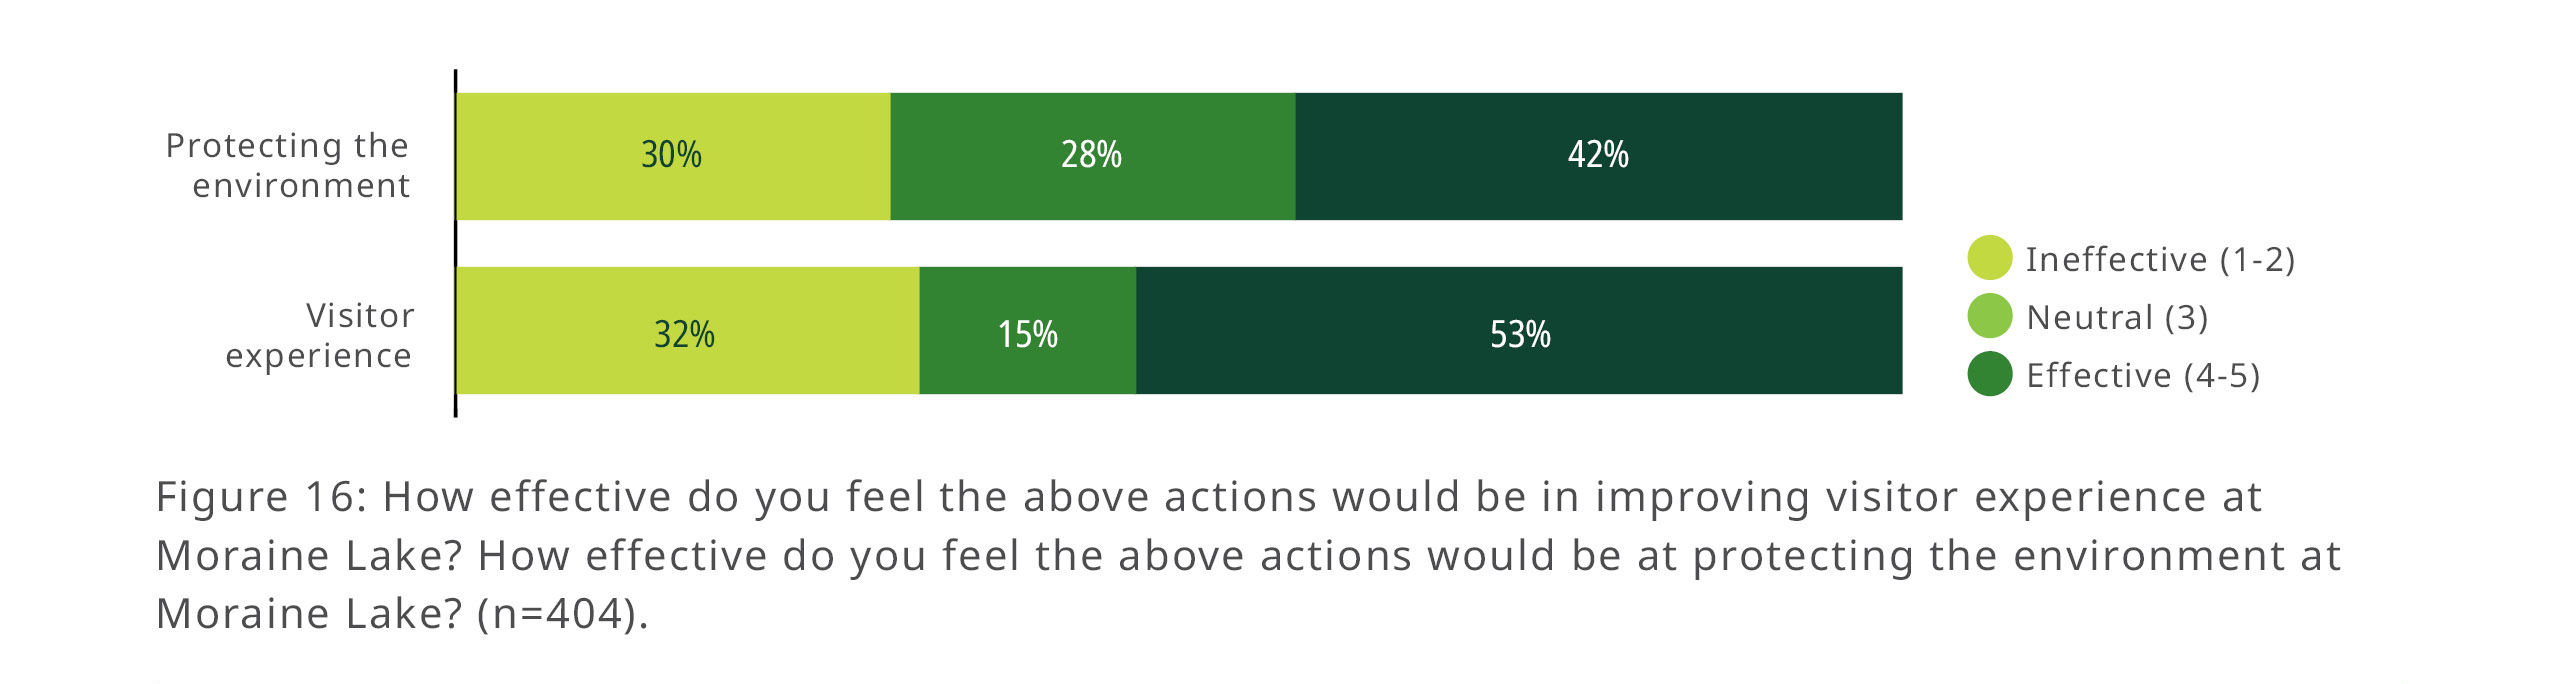
Figure 16: How effective do you feel the above actions would be in improving visitor experience at Moraine Lake? How effective do you feel the above actions would be at protecting the environment at Moraine Lake? (n=404).
Protecting the environment
- Ineffective (1-2) 30%
- Neither (3) 52 28%
- Effective (4-5) 42%
Visitor experience
- Ineffective (1-2) 32%
- Neither (3) 15%
- Effective (4-5) 53%
When asked what concerns they had about capacity allocation, respondents (n=304) often supported setting visitation limits because they feel the area is overcrowded (34%). However, they nearly always paired this support with concerns about equity, specifically who would have access and whether allocation would be fair.
- Equity - Respondents raised concerns about access for locals (23%), and Canadians (10%) as well as affordability of shuttle fees (8%). They also questioned how capacity would be allocated fairly. Many suggested setting aside seats, using tiered pricing or offering different booking windows for these groups.
- Commercial operators – Respondents frequently perceived commercial operators as expensive and profit-driven, and the volume of operators as harmful to the area (17%). Some asked Parks Canada to prioritize subsidized, public transportation operators, such as Parks Canada and Roam Public Transit (5%) and, if selecting commercial operators, to prioritize local companies. These responses were often also paired with concerns about Moraine Lake ultimately becoming unaffordable to visit.
- Key user groups - Respondents asked for dedicated capacity for climbers, hikers and mountaineers who need more time for safety (17%) and requested affordable early-morning shuttle options and flexible return times. Many expressed Moraine Lake should be viewed not only as a destination, but as an important access point for backcountry activities.
- Reservation systems – Many respondents expressed concerns about the current system including struggles to secure tickets and fears that limited capacity could worsen this issue. Specific concerns included purchasing by bots, unfair booking practices and reselling. Many preferred lottery systems, rolling ticket releases and last-minute release of seats over the current reservation service.
Respondents also called for safer cycling access and infrastructure (6%), systems that prioritize the environment (8%) and wildlife (4%), and stronger enforcement for rule violations (4%).
Paradise Valley
Nearly one quarter (24%) of respondents (n=306) who took part in the third survey chose to skip questions pertaining to Paradise Valley. However, 92% of Bow Valley respondents who took part in this third survey decided to complete this section.
Over 65% of respondents were supportive of these actions.
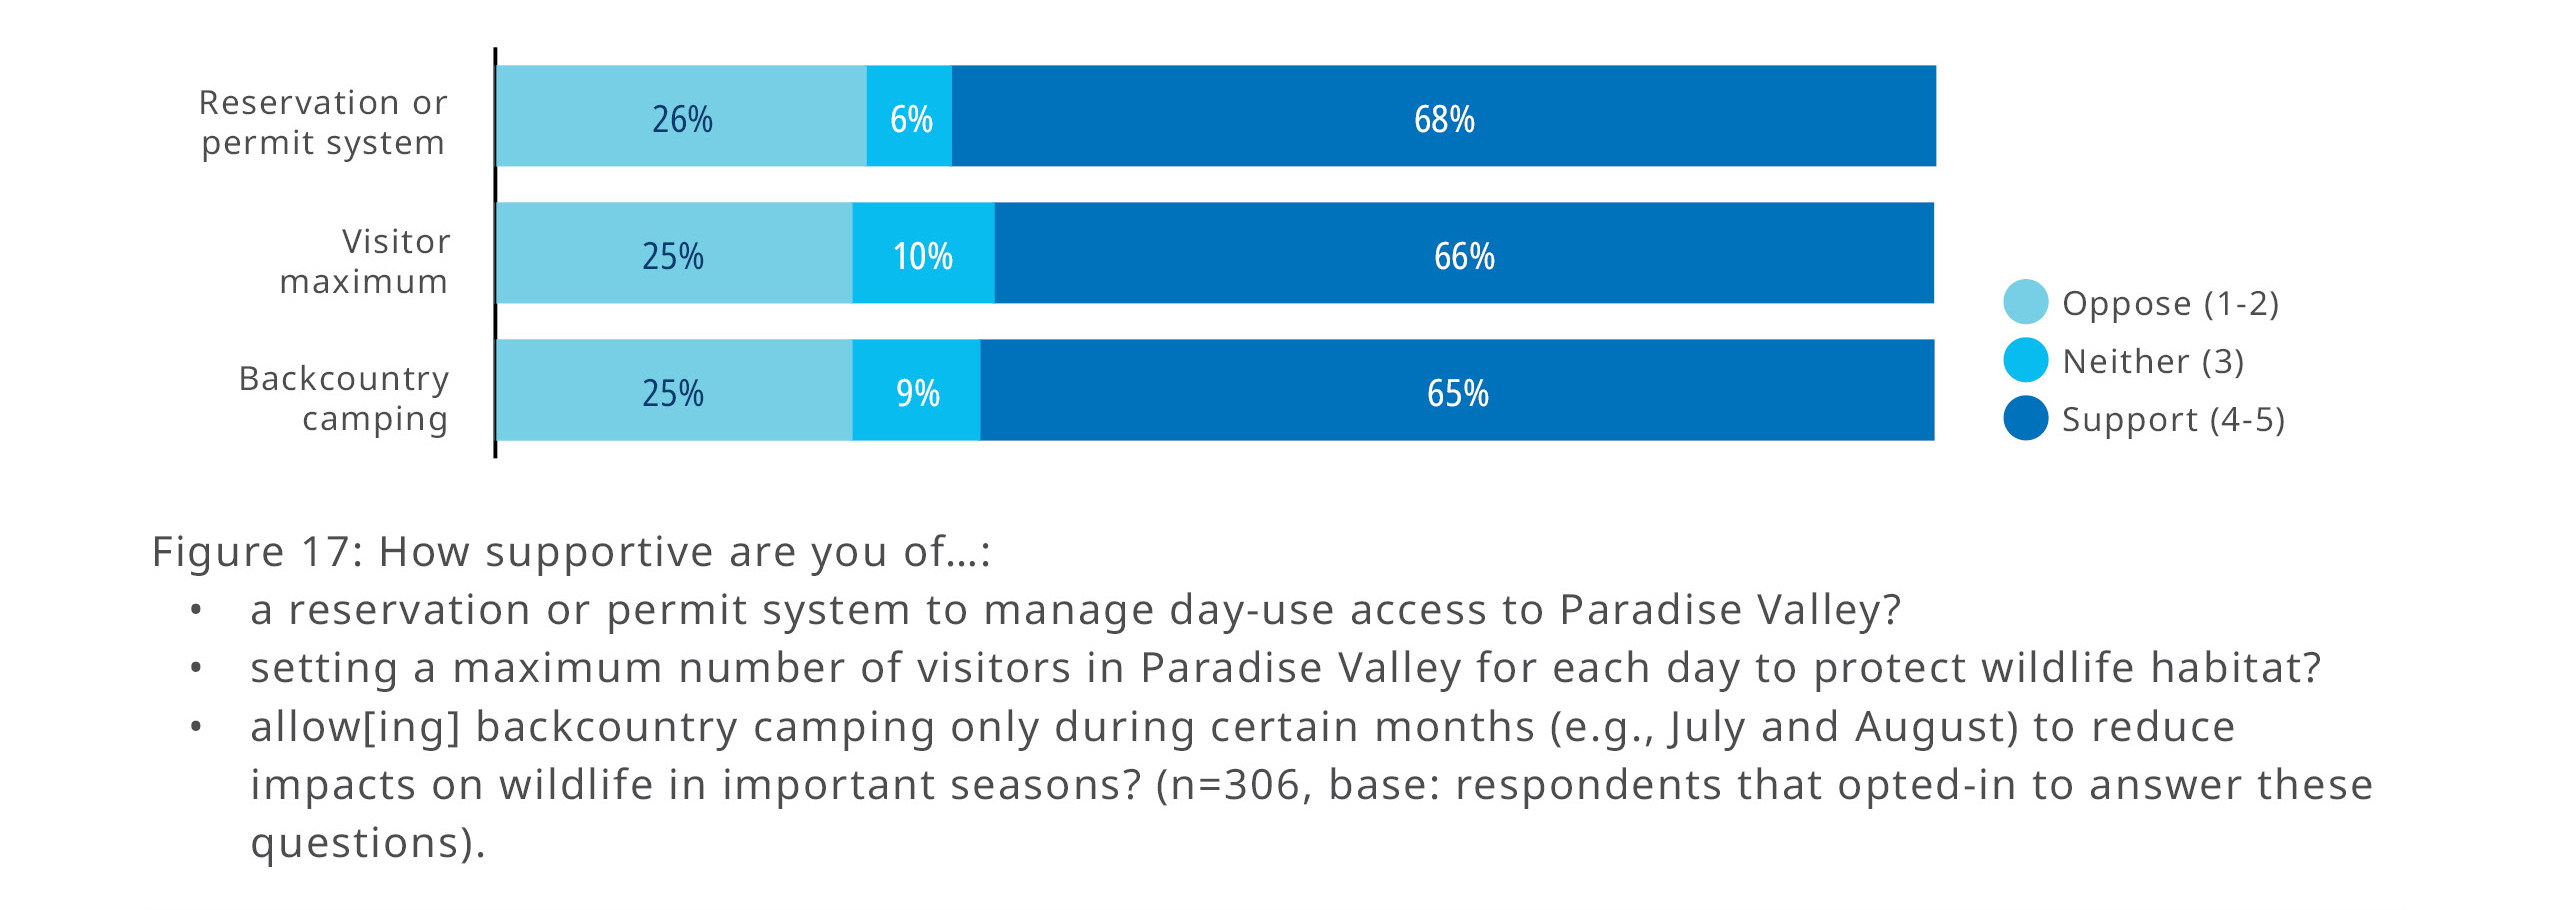
Figure 17: How supportive are you of…:
- a reservation or permit system to manage day-use access to Paradise Valley?
- setting a maximum number of visitors in Paradise Valley for each day to protect wildlife habitat?
- allow[ing] backcountry camping only during certain months (e.g., July and August) to reduce
- impacts on wildlife in important seasons? (n=306, base: respondents that opted-in to answer these questions).
Reservation or permit system
- Oppose (1-2) 26%
- Neither (3) 6%
- Support (4-5) 68%
Visitor maximum
- Oppose (1-2) 25%
- Neither (3) 10%
- Support (4-5) 66%
Backcountry camping
- Oppose (1-2) 25%
- Neither (3) 9%
- Support (4-5) 65%
When asked about these proposed actions or other ideas to achieve the desired conditions at Paradise Valley several key themes emerged (n=175, based on those who provided comments).
Overall, respondents generally supported the proposed actions. Many supported limiting use to protect the area and reduce impacts on wildlife (7%), believing the area has become overcrowded (19%). Others felt the proposed actions were too restrictive (20%) and unnecessary because visitation is already low compared to nearby locations. Several asked for clearer evidence on visitor numbers and wildlife before changes are made.
Regardless of their overall position, many respondents discussed reservation systems emphasizing a need for fairness and affordability, supporting permit or random draw system (5%), and stronger on-site enforcement (8%). Respondents also frequently requested priority access for Canadians (6%), as well as locals (18%).
Back to topConclusion
Thank you to everyone who participated in this phase of public engagement for the Lake Louise Area Visitor Use Management Plan. Public feedback will be taken into account as Parks Canada assesses strategies and actions for viability, feasibility and desirability.
For details and project updates, please visit:
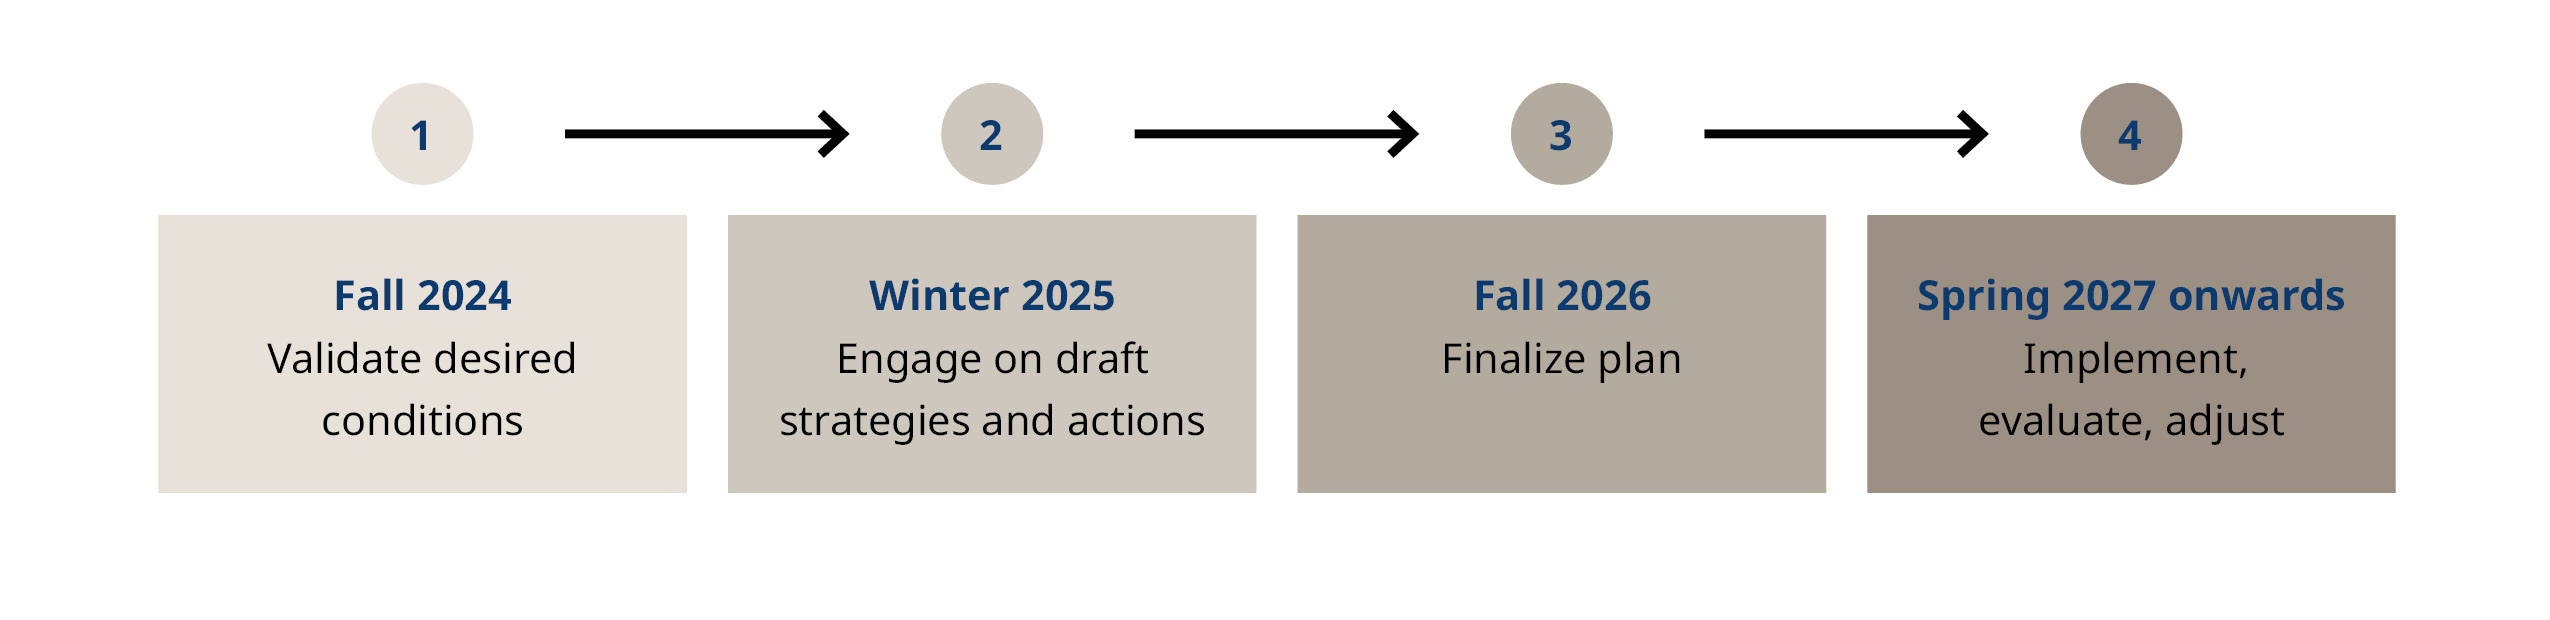
The remaining steps in the VUM Framework will be completed by Parks Canada in 2026 with the final Lake Louise Visitor Use Management Plan anticipated in fall 2026.