

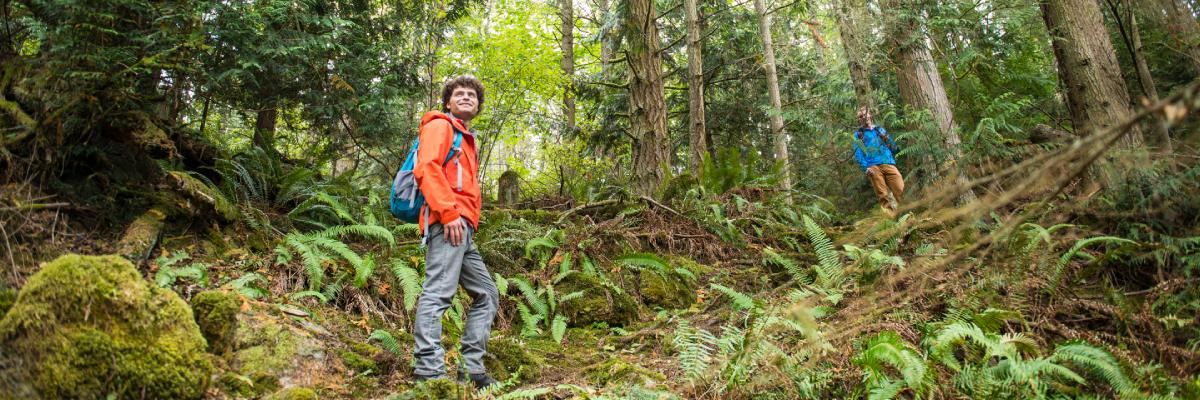
Parks Canada’s Dr. Tara Sharma with Dr. Werner Kurz of the Canadian Forest Service
Mapping the carbon landscape
Parks Canada’s Carbon Atlas will help us better understand the role of our protected areas in capturing, storing, and releasing carbon.
Any atlas—of the world, the solar system, or the human body—allows us to visualize the geography of our situation. Parks Canada’s Carbon Atlas does exactly that for the carbon landscape.
Carbon dioxide, the primary contributor to climate change, is released mainly as a result of human activities. A substantial amount of carbon is also released through processes that occur in nature, such as decomposition and wildfires.
The Carbon Atlas helps us understand the overall role of our protected areas in both capturing and releasing carbon dioxide. This big-picture project is the work of Dr. Tara Sharma, an ecosystem scientist at Parks Canada, in collaboration with Dr. Werner Kurz and his team at the Canadian Forest Service.
The first report in the atlas is complete and available.
Finding the carbon balance
Carbon in, carbon out is a simple way of understanding the process at the heart of ecosystems.
Ecosystems act as carbon “sinks,” absorbing carbon dioxide through trees, soils, mosses, and phytoplankton (tiny plants and plantlike organisms living in water).
But ecosystems are also carbon “sources,” releasing the gas through such processes as decomposition and fires.
What we don’t really know, says Dr. Sharma, is the carbon balance. Does a particular park release more carbon than it stores, or vice versa?
Answering that question requires data…lots of it.
Dr. Sharma has crunched the numbers using forest inventories as well as information about disturbances such as wildfires, insect infestations and prescribed fires. Her data cover the period from 1990 to 2020.
The information goes into the computer model developed by the Canadian Forest Service. The model can estimate carbon stocks as well as carbon fluxes (the flow of carbon within an ecosystem and atmosphere).
The result is the bottom line on carbon—a picture of which parks are sinks, and which are sources, for the timeframe of the study.
-
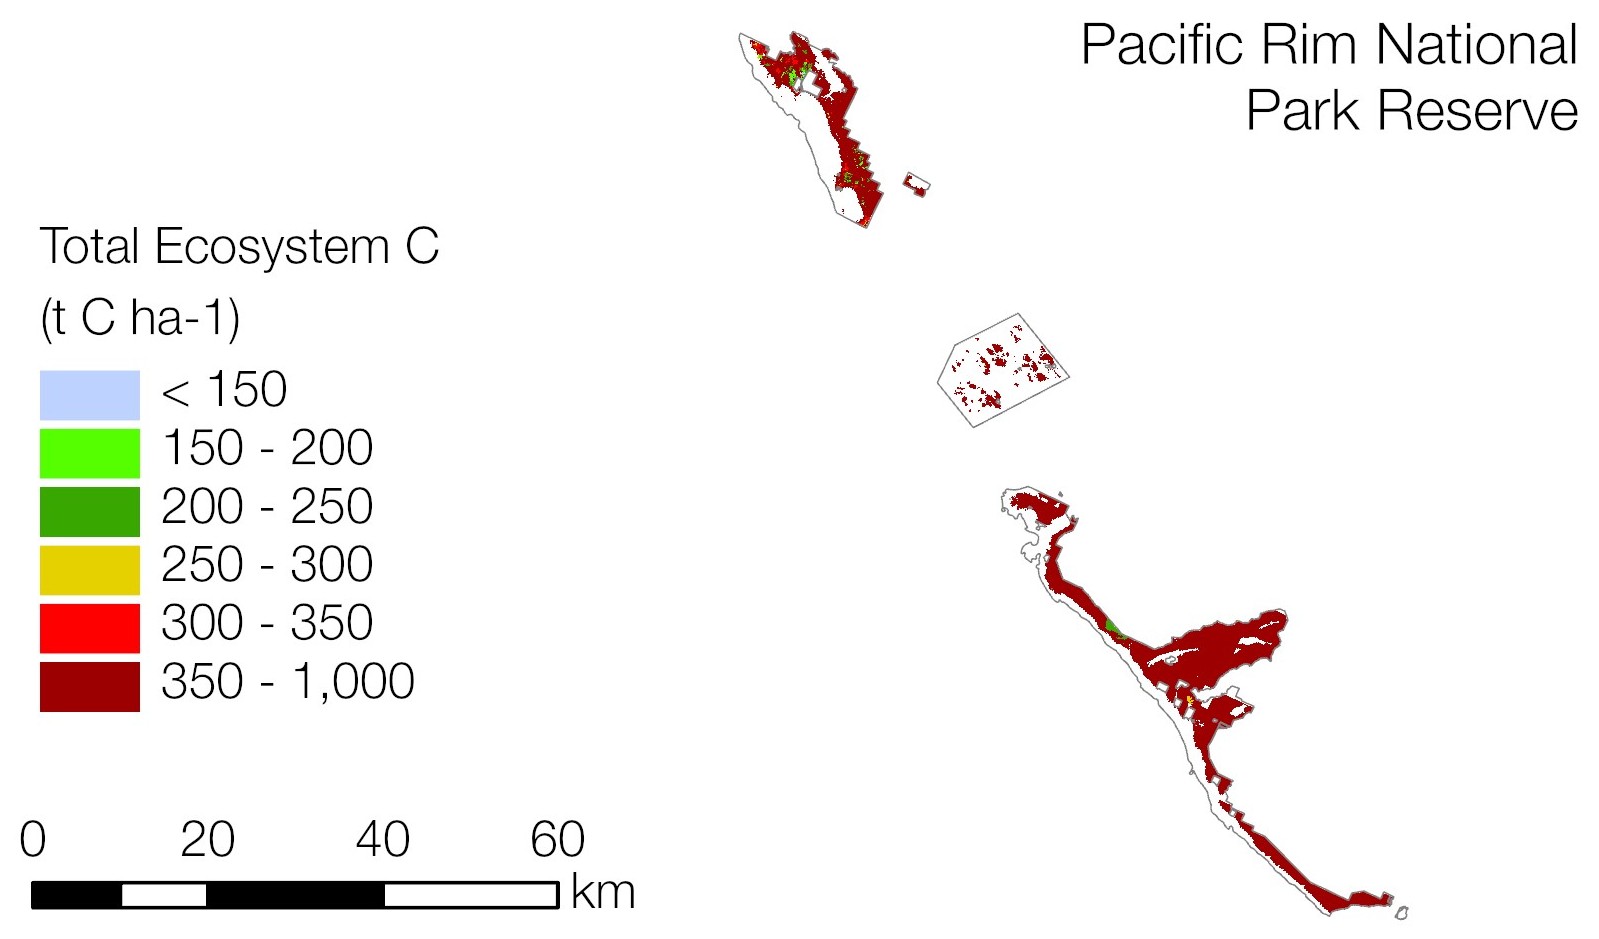
Text version
A carbon map of Pacific Rim National Park Reserve in British Columbia. The various colours represent different amounts of stored carbon, with dark red indicating the highest amounts (350-1,000 tonnes per hectare) and blue the lowest (less than 150 tonnes per hectare). The dark green represents mid-range amounts of stored carbon (200 to 250 tonnes per hectare). There is an abundance of dark red across the national park reserve.
A guide for carbon-smart restoration
The atlas provides a picture of carbon distribution in a particular park, and so can serve as a guide in planning (say) reforestation and other kinds of restoration.
More generally, the atlas helps us understand the living landscape of carbon and how it has changed in the past 30 years.
Some undisturbed parks have acted as sinks of carbon for this study period. But others—notably Wood Buffalo National Park and Waterton Lakes National Park, which were affected by major wildfires over the past few years—were net carbon sources for the period.
Collectively, says Dr. Sharma, “the sink is getting smaller.” The effects of climate change—including the increased frequency and intensity of insect infestations and wildfires—are whittling away at the capacity of protected areas to store and sequester carbon.
Although the first installment of the atlas will cover just forested ecosystems, future versions will include other ecosystems such as grasslands, tundra, peatlands, eelgrass beds and salt marshes. It will cover national parks as well as national marine conservation areas.
A good atlas shows us where we are and what’s out there (or, in the case of a medical atlas, what’s in here). Over the next few years, the Parks Canada Carbon Atlas will do just that for the carbon landscape of our protected areas.
- Date modified :